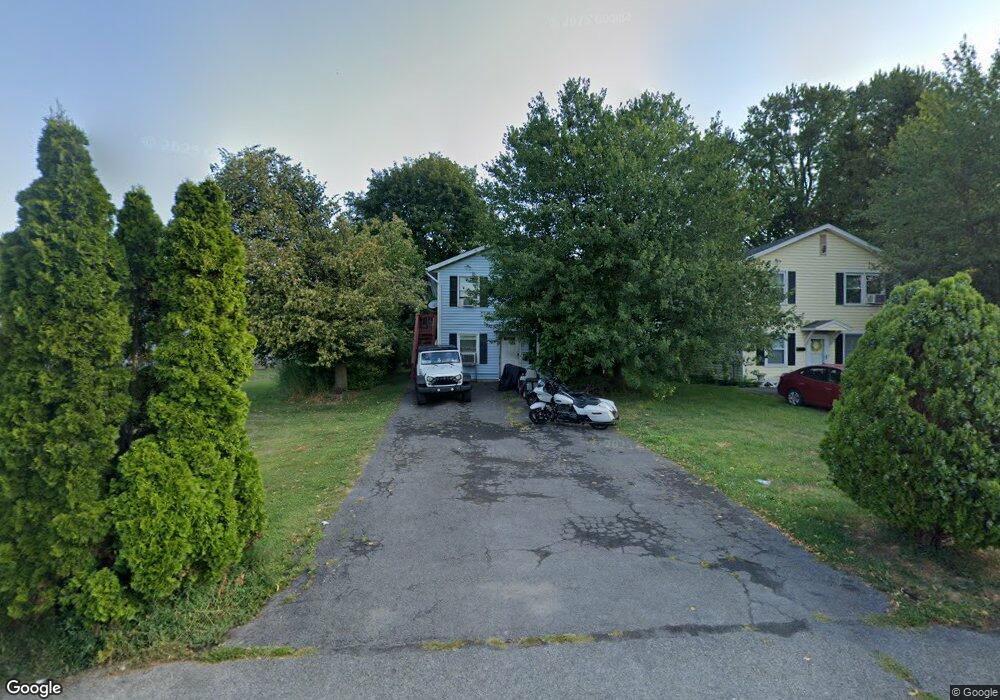
1 Avenue B Albany, NY 12209
Delaware Avenue NeighborhoodEstimated Value: $219,000 - $296,000
5
Beds
2
Baths
2,050
Sq Ft
$121/Sq Ft
Est. Value
About This Home
This home is located at 1 Avenue B, Albany, NY 12209 and is currently estimated at $247,592, approximately $120 per square foot. 1 Avenue B is a home located in Albany County with nearby schools including Delaware Community School, William S Hackett Middle School, and Albany High School.
Ownership History
Date
Name
Owned For
Owner Type
Purchase Details
Closed on
Dec 16, 2011
Sold by
Fontane Paul T
Bought by
Campbell Kelly
Current Estimated Value
Home Financials for this Owner
Home Financials are based on the most recent Mortgage that was taken out on this home.
Original Mortgage
$114,034
Outstanding Balance
$77,932
Interest Rate
3.99%
Estimated Equity
$169,660
Purchase Details
Closed on
Jan 31, 2001
Sold by
Allied Associates Llc
Bought by
Bourne Claudianus
Create a Home Valuation Report for This Property
The Home Valuation Report is an in-depth analysis detailing your home's value as well as a comparison with similar homes in the area
Home Values in the Area
Average Home Value in this Area
Purchase History
| Date | Buyer | Sale Price | Title Company |
|---|---|---|---|
| Campbell Kelly | $117,000 | None Available | |
| Bourne Claudianus | $97,000 | Steve Reilly |
Source: Public Records
Mortgage History
| Date | Status | Borrower | Loan Amount |
|---|---|---|---|
| Open | Campbell Kelly | $114,034 |
Source: Public Records
Tax History Compared to Growth
Tax History
| Year | Tax Paid | Tax Assessment Tax Assessment Total Assessment is a certain percentage of the fair market value that is determined by local assessors to be the total taxable value of land and additions on the property. | Land | Improvement |
|---|---|---|---|---|
| 2024 | $4,539 | $189,000 | $37,800 | $151,200 |
| 2023 | $4,070 | $112,000 | $22,400 | $89,600 |
| 2022 | $3,906 | $112,000 | $22,400 | $89,600 |
| 2021 | $3,872 | $112,000 | $22,400 | $89,600 |
| 2020 | $4,521 | $112,000 | $22,400 | $89,600 |
| 2019 | $4,409 | $112,000 | $22,400 | $89,600 |
| 2018 | $4,116 | $112,000 | $22,400 | $89,600 |
| 2017 | $1,626 | $112,000 | $22,400 | $89,600 |
| 2016 | $3,507 | $112,000 | $22,400 | $89,600 |
| 2015 | $1,802 | $110,000 | $28,900 | $81,100 |
| 2014 | -- | $110,000 | $28,900 | $81,100 |
Source: Public Records
Map
Nearby Homes