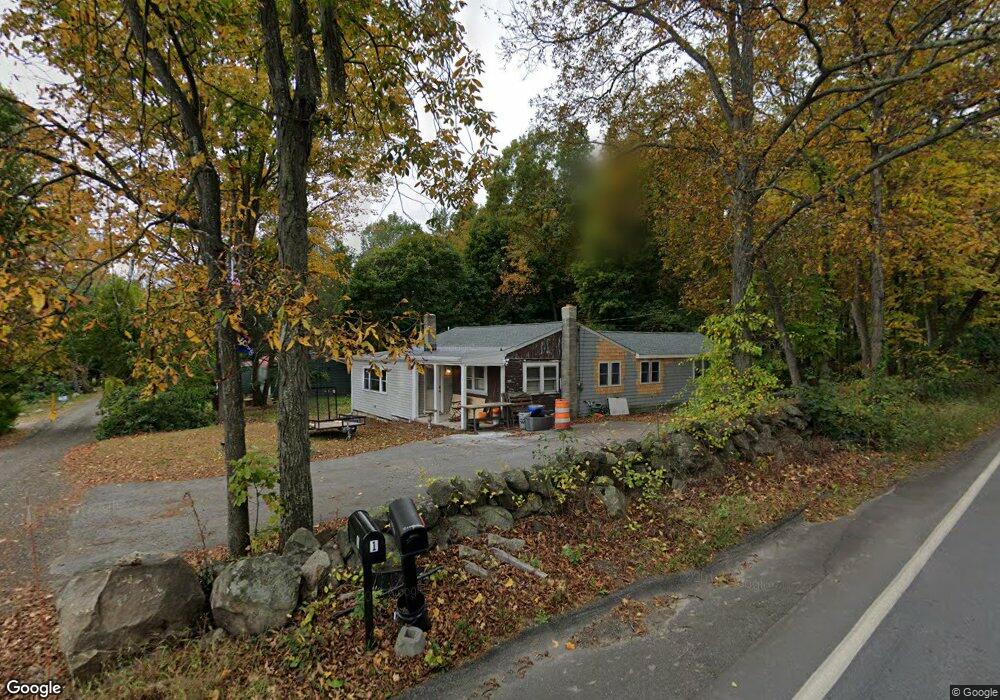
1 Lemyjoma Trail Sandown, NH 03873
Estimated Value: $351,309 - $460,000
2
Beds
1
Bath
1,144
Sq Ft
$346/Sq Ft
Est. Value
About This Home
This home is located at 1 Lemyjoma Trail, Sandown, NH 03873 and is currently estimated at $395,327, approximately $345 per square foot. 1 Lemyjoma Trail is a home located in Rockingham County with nearby schools including Sandown North Elementary School, Timberlane Regional Middle School, and Timberlane Regional High School.
Ownership History
Date
Name
Owned For
Owner Type
Purchase Details
Closed on
Jul 15, 2019
Sold by
Freeman Sarah L
Bought by
Freeman Peter A
Current Estimated Value
Home Financials for this Owner
Home Financials are based on the most recent Mortgage that was taken out on this home.
Original Mortgage
$182,400
Outstanding Balance
$159,111
Interest Rate
3.82%
Mortgage Type
New Conventional
Estimated Equity
$236,216
Purchase Details
Closed on
Jul 2, 2009
Sold by
United Guaranty Reside
Bought by
Wilson Kerrianne and Wilson Bruce E
Home Financials for this Owner
Home Financials are based on the most recent Mortgage that was taken out on this home.
Original Mortgage
$128,627
Interest Rate
4.86%
Mortgage Type
Purchase Money Mortgage
Purchase Details
Closed on
May 26, 2005
Sold by
Mohan Michael N
Bought by
Wells Fargo Bk
Purchase Details
Closed on
Dec 26, 2002
Sold by
Beal William E and Beal Dawn A
Bought by
Mohan Michael N
Purchase Details
Closed on
Dec 30, 1997
Sold by
Lebel Ernest J and Lebel Helen E
Bought by
Beal William E
Create a Home Valuation Report for This Property
The Home Valuation Report is an in-depth analysis detailing your home's value as well as a comparison with similar homes in the area
Home Values in the Area
Average Home Value in this Area
Purchase History
| Date | Buyer | Sale Price | Title Company |
|---|---|---|---|
| Freeman Peter A | -- | -- | |
| Freeman Peter A | -- | -- | |
| Freeman Peter A | -- | -- | |
| Wilson Kerrianne | $131,000 | -- | |
| United Guaranty Reside | $163,400 | -- | |
| United Guaranty Reside | $163,400 | -- | |
| Wells Fargo Bk | $195,000 | -- | |
| Wells Fargo Bk | $195,000 | -- | |
| Mohan Michael N | $183,000 | -- | |
| Mohan Michael N | $183,000 | -- | |
| Beal William E | $97,500 | -- | |
| Beal William E | $97,500 | -- |
Source: Public Records
Mortgage History
| Date | Status | Borrower | Loan Amount |
|---|---|---|---|
| Open | Freeman Peter A | $182,400 | |
| Closed | Freeman Peter A | $182,400 | |
| Previous Owner | Beal William E | $128,627 | |
| Previous Owner | Beal William E | $0 |
Source: Public Records
Tax History Compared to Growth
Tax History
| Year | Tax Paid | Tax Assessment Tax Assessment Total Assessment is a certain percentage of the fair market value that is determined by local assessors to be the total taxable value of land and additions on the property. | Land | Improvement |
|---|---|---|---|---|
| 2024 | $4,134 | $233,300 | $110,600 | $122,700 |
| 2023 | $4,876 | $233,300 | $110,600 | $122,700 |
| 2022 | $4,897 | $172,600 | $100,500 | $72,100 |
| 2021 | $5,002 | $172,600 | $100,500 | $72,100 |
| 2020 | $4,774 | $172,600 | $100,500 | $72,100 |
| 2019 | $4,653 | $172,600 | $100,500 | $72,100 |
| 2018 | $4,581 | $172,600 | $100,500 | $72,100 |
| 2017 | $4,177 | $135,700 | $80,400 | $55,300 |
| 2016 | $3,957 | $135,700 | $80,400 | $55,300 |
| 2015 | $3,615 | $135,700 | $80,400 | $55,300 |
| 2014 | $3,744 | $135,700 | $80,400 | $55,300 |
| 2013 | $3,675 | $135,700 | $80,400 | $55,300 |
Source: Public Records
Map
Nearby Homes
- 9 Trues Pkwy
- 7 Trues Pkwy
- 5 Grandview Terrace
- 26 Main St
- 39 Kibrel Ct
- 33 Pillsbury Rd
- 55 Judith St
- 13 Autumn Ln
- 31 Beatrice St
- 143 Colby Rd
- 79 Highland Dr
- 55 Woodridge Rd
- 00 Woodridge Rd
- 185 Buttrick Rd
- 57 Hampstead Rd
- 8 Ians Path
- 1 Remington Dr Unit 904C
- 14 Meredith Dr
- 6 Russett Ln
- 16 Edmund Meadow Ln