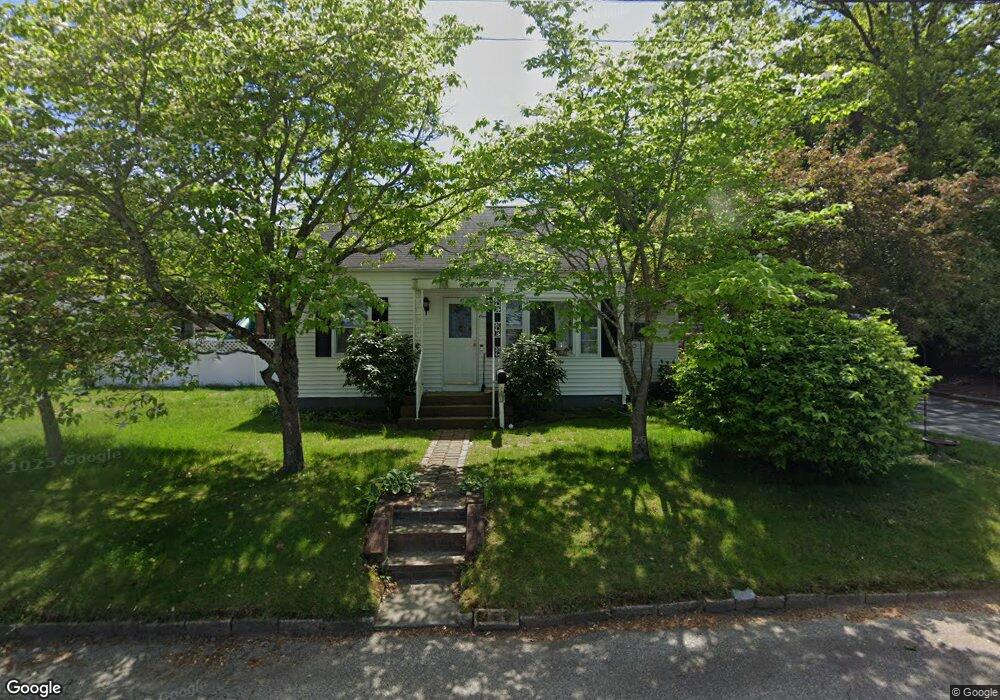
1 Notre Dame St Coventry, RI 02816
Estimated Value: $306,000 - $368,000
3
Beds
1
Bath
936
Sq Ft
$365/Sq Ft
Est. Value
About This Home
This home is located at 1 Notre Dame St, Coventry, RI 02816 and is currently estimated at $341,339, approximately $364 per square foot. 1 Notre Dame St is a home located in Kent County with nearby schools including Alan Shawn Feinstein Ms Of Cov, Coventry High School, and St Joseph School.
Ownership History
Date
Name
Owned For
Owner Type
Purchase Details
Closed on
Jul 22, 2013
Sold by
Est Bertholdt Alice I and Blais Linda N
Bought by
Blais Linda N and Blais Jacob J
Current Estimated Value
Home Financials for this Owner
Home Financials are based on the most recent Mortgage that was taken out on this home.
Original Mortgage
$88,000
Outstanding Balance
$63,989
Interest Rate
3.92%
Estimated Equity
$277,350
Create a Home Valuation Report for This Property
The Home Valuation Report is an in-depth analysis detailing your home's value as well as a comparison with similar homes in the area
Home Values in the Area
Average Home Value in this Area
Purchase History
| Date | Buyer | Sale Price | Title Company |
|---|---|---|---|
| Blais Linda N | $110,000 | -- |
Source: Public Records
Mortgage History
| Date | Status | Borrower | Loan Amount |
|---|---|---|---|
| Closed | Blais Linda N | $35,000 | |
| Open | Blais Linda N | $88,000 |
Source: Public Records
Tax History Compared to Growth
Tax History
| Year | Tax Paid | Tax Assessment Tax Assessment Total Assessment is a certain percentage of the fair market value that is determined by local assessors to be the total taxable value of land and additions on the property. | Land | Improvement |
|---|---|---|---|---|
| 2024 | $3,657 | $230,900 | $89,100 | $141,800 |
| 2023 | $3,540 | $230,900 | $89,100 | $141,800 |
| 2022 | $3,495 | $178,600 | $87,100 | $91,500 |
| 2021 | $3,465 | $178,600 | $87,100 | $91,500 |
| 2020 | $3,972 | $178,600 | $87,100 | $91,500 |
| 2019 | $3,307 | $148,700 | $66,400 | $82,300 |
| 2018 | $3,213 | $148,700 | $66,400 | $82,300 |
| 2017 | $3,120 | $148,700 | $66,400 | $82,300 |
| 2016 | $3,027 | $141,400 | $65,200 | $76,200 |
| 2015 | $2,945 | $141,400 | $65,200 | $76,200 |
| 2014 | $2,884 | $141,400 | $65,200 | $76,200 |
| 2013 | $3,008 | $161,200 | $88,200 | $73,000 |
Source: Public Records
Map
Nearby Homes