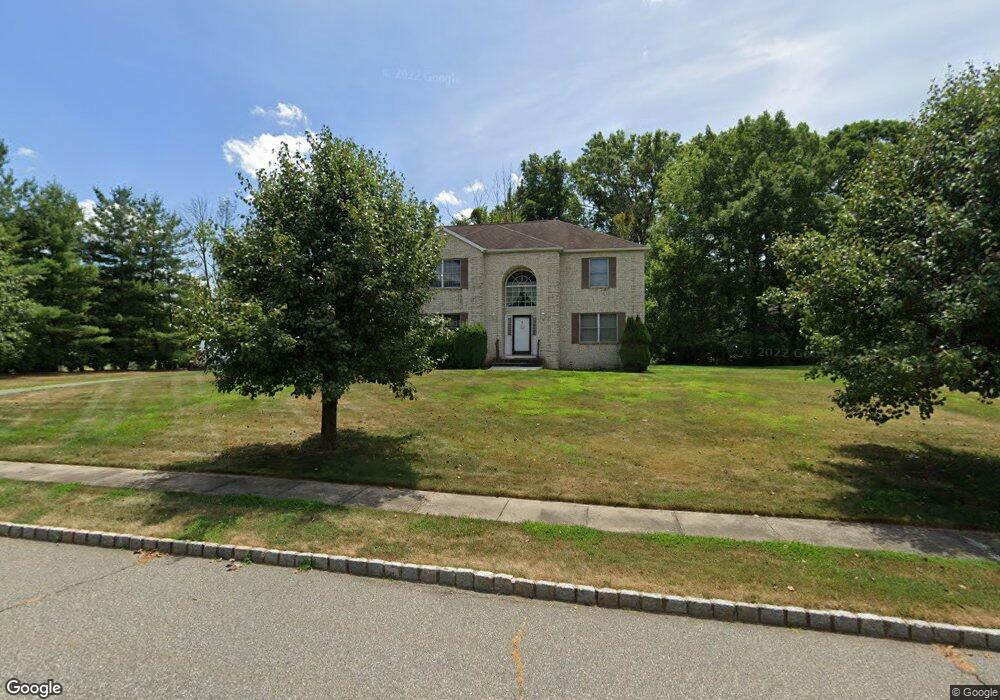
1 Samuel Ct Cedar Knolls, NJ 07927
Estimated Value: $986,609 - $1,295,000
--
Bed
--
Bath
2,727
Sq Ft
$428/Sq Ft
Est. Value
About This Home
This home is located at 1 Samuel Ct, Cedar Knolls, NJ 07927 and is currently estimated at $1,166,152, approximately $427 per square foot. 1 Samuel Ct is a home located in Morris County with nearby schools including Whippany Park High School, Unity Charter School, and Allegro School.
Ownership History
Date
Name
Owned For
Owner Type
Purchase Details
Closed on
Apr 26, 1999
Sold by
Justin Drive Associates Inc
Bought by
Banerjee Gautam and Chakraborty Banani
Current Estimated Value
Home Financials for this Owner
Home Financials are based on the most recent Mortgage that was taken out on this home.
Original Mortgage
$240,000
Outstanding Balance
$61,549
Interest Rate
6.95%
Mortgage Type
Stand Alone First
Estimated Equity
$1,104,603
Purchase Details
Closed on
Aug 26, 1997
Sold by
Hughey Samuel J and Hughey Jane
Bought by
Justin Drive Associates Inc
Home Financials for this Owner
Home Financials are based on the most recent Mortgage that was taken out on this home.
Original Mortgage
$230,500
Interest Rate
7.31%
Purchase Details
Closed on
Mar 18, 1997
Sold by
Smiecinski Mark P and Smiecinski Gail R
Bought by
Hughey Samuel J and Hughey Jane
Create a Home Valuation Report for This Property
The Home Valuation Report is an in-depth analysis detailing your home's value as well as a comparison with similar homes in the area
Home Values in the Area
Average Home Value in this Area
Purchase History
| Date | Buyer | Sale Price | Title Company |
|---|---|---|---|
| Banerjee Gautam | $395,000 | Chicago Title Insurance Co | |
| Justin Drive Associates Inc | $325,000 | -- | |
| Hughey Samuel J | -- | -- |
Source: Public Records
Mortgage History
| Date | Status | Borrower | Loan Amount |
|---|---|---|---|
| Open | Banerjee Gautam | $240,000 | |
| Previous Owner | Justin Drive Associates Inc | $230,500 |
Source: Public Records
Tax History Compared to Growth
Tax History
| Year | Tax Paid | Tax Assessment Tax Assessment Total Assessment is a certain percentage of the fair market value that is determined by local assessors to be the total taxable value of land and additions on the property. | Land | Improvement |
|---|---|---|---|---|
| 2025 | $13,073 | $610,600 | $219,200 | $391,400 |
| 2024 | $12,908 | $610,600 | $219,200 | $391,400 |
| 2023 | $12,908 | $610,600 | $219,200 | $391,400 |
| 2022 | $11,809 | $610,600 | $219,200 | $391,400 |
| 2021 | $11,809 | $610,600 | $219,200 | $391,400 |
| 2020 | $11,107 | $610,600 | $219,200 | $391,400 |
| 2019 | $11,675 | $610,600 | $219,200 | $391,400 |
| 2018 | $11,491 | $610,600 | $219,200 | $391,400 |
| 2017 | $11,229 | $610,600 | $219,200 | $391,400 |
| 2016 | $11,058 | $610,600 | $219,200 | $391,400 |
| 2015 | $10,631 | $610,600 | $219,200 | $391,400 |
| 2014 | $10,411 | $610,600 | $219,200 | $391,400 |
Source: Public Records
Map
Nearby Homes
- 83 Mountain Ave
- 104 Ridgedale Ave
- 13 Mountview Rd
- 16 Slope Dr
- Route 10 E E Route 10 Unit 48 1B
- 54 Locust Dr
- 15 Horsehill Rd
- 17 Horsehill Rd
- 241 Vista Dr
- 709 Brook Hollow Dr Unit 709
- 9 Evergreen Ln
- 112 Vista Dr Unit B12
- 143 Vista Dr
- 22 Karla Dr
- 3306 Appleton Way
- 15 Beech Dr
- 26 Gladstone Ct
- 42 Gladstone Ct
- 34 Gladstone Ct
- 14 Gladstone Ct
- 13 Gristmill Rd
- 20 Ridgedale Ave
- 3 Samuel Ct
- 11 Gristmill Rd
- 44 Ridgedale Ave Unit 1
- 4 Samuel Ct
- 15 Gristmill Rd
- 29 Ridgedale Ave
- 6 Samuel Ct
- 8 Samuel Ct
- 7 Gristmill Rd
- 16 Ridgedale Ave
- 17 Gristmill Rd
- 33 Ridgedale Ave
- 10 Gristmill Rd
- 16 Gristmill Rd
- 5 Gristmill Rd
- 131 Malapardis Rd
- 43 Ridgedale Ave
- 19 Gristmill Rd