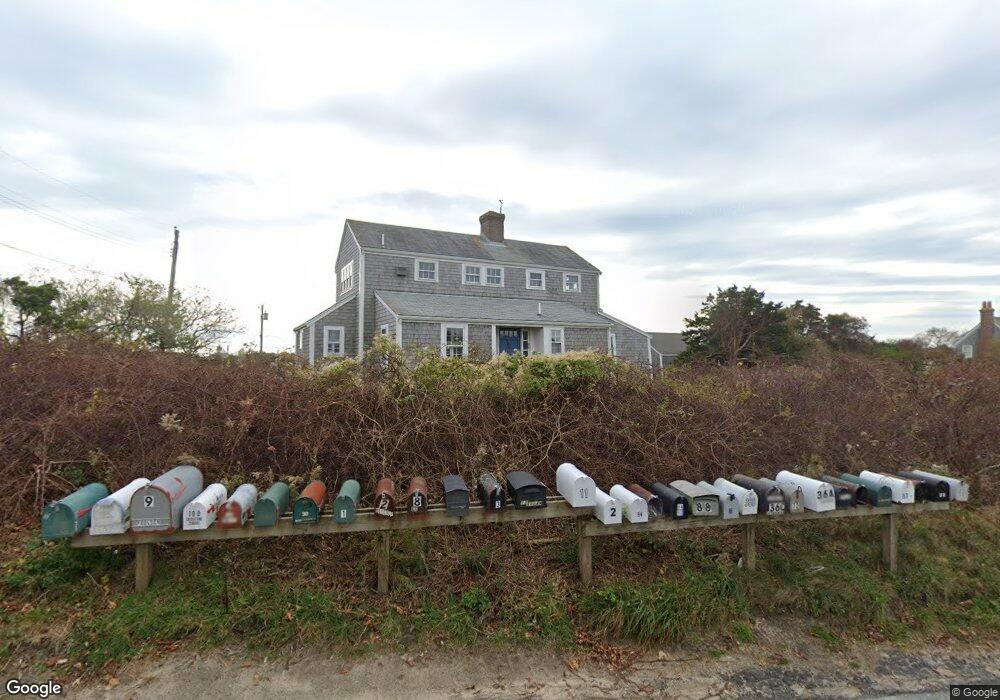
1 Sesachacha Rd Nantucket, MA 02554
Estimated Value: $3,355,000 - $5,916,000
4
Beds
2
Baths
1,861
Sq Ft
$2,326/Sq Ft
Est. Value
About This Home
This home is located at 1 Sesachacha Rd, Nantucket, MA 02554 and is currently estimated at $4,329,106, approximately $2,326 per square foot. 1 Sesachacha Rd is a home located in Nantucket County with nearby schools including Nantucket Elementary School, Cyrus Peirce Middle School, and Nantucket High School.
Ownership History
Date
Name
Owned For
Owner Type
Purchase Details
Closed on
Jul 15, 2008
Sold by
Churchill-Crowell Nt
Bought by
Seibert Gregg
Current Estimated Value
Purchase Details
Closed on
Mar 9, 2007
Sold by
Albright Ralph N and Albright Susanne S
Bought by
Albright Jr Tr Ralph N and Albright Susanne S
Purchase Details
Closed on
Sep 7, 2006
Sold by
Albright Ralph N
Bought by
Albright Ralph N and Albright Susanne S
Create a Home Valuation Report for This Property
The Home Valuation Report is an in-depth analysis detailing your home's value as well as a comparison with similar homes in the area
Home Values in the Area
Average Home Value in this Area
Purchase History
| Date | Buyer | Sale Price | Title Company |
|---|---|---|---|
| Seibert Gregg | -- | -- | |
| Albright Jr Tr Ralph N | -- | -- | |
| Albright Ralph N | -- | -- | |
| Albright Ralph N | -- | -- |
Source: Public Records
Tax History Compared to Growth
Tax History
| Year | Tax Paid | Tax Assessment Tax Assessment Total Assessment is a certain percentage of the fair market value that is determined by local assessors to be the total taxable value of land and additions on the property. | Land | Improvement |
|---|---|---|---|---|
| 2025 | $8,180 | $2,494,000 | $1,775,500 | $718,500 |
| 2023 | $7,090 | $2,208,800 | $1,690,700 | $518,100 |
| 2022 | $5,567 | $1,488,500 | $1,102,600 | $385,900 |
| 2021 | $5,848 | $1,611,000 | $1,225,100 | $385,900 |
| 2020 | $5,628 | $1,631,300 | $1,225,100 | $406,200 |
| 2019 | $5,481 | $1,631,300 | $1,225,100 | $406,200 |
| 2018 | $6,268 | $1,762,300 | $1,396,700 | $365,600 |
| 2017 | $5,940 | $1,752,100 | $1,396,700 | $355,400 |
| 2016 | $5,688 | $1,693,000 | $1,347,700 | $345,300 |
| 2015 | $5,185 | $1,436,300 | $1,121,600 | $314,700 |
| 2014 | $5,336 | $1,419,100 | $1,104,400 | $314,700 |
Source: Public Records
Map
Nearby Homes