1 Tulip Ave Hampton Bays, NY 11946
Estimated Value: $1,028,000 - $1,146,000
4
Beds
2
Baths
2,222
Sq Ft
$491/Sq Ft
Est. Value
About This Home
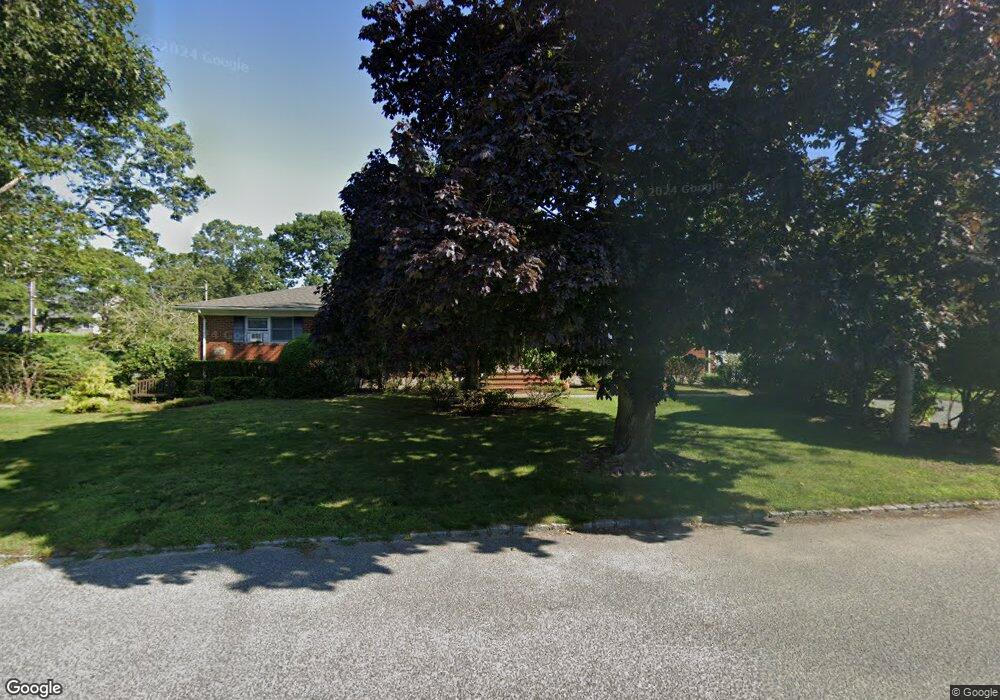
This home is located at 1 Tulip Ave, Hampton Bays, NY 11946 and is currently estimated at $1,090,456, approximately $490 per square foot. 1 Tulip Ave is a home located in Suffolk County with nearby schools including Hampton Bays Secondary School, Hampton Bays Elementary School, and Hampton Bays Middle School.
Ownership History
Date
Name
Owned For
Owner Type
Purchase Details
Closed on
Nov 12, 2014
Sold by
Weglein Gabrielle and Rossiter Robert J
Bought by
Weglein Gabrielle
Current Estimated Value
Purchase Details
Closed on
Oct 21, 1995
Sold by
Gillette Dena
Bought by
Rossiter Moira A and Weglein Gabrielle
Purchase Details
Closed on
Sep 19, 1995
Sold by
Galante Mary Lou and Bastiao Mary Lou
Bought by
Gillette Dena
Purchase Details
Closed on
Jun 20, 1995
Sold by
County Of Suffolk
Bought by
Galante Mary Lou and Bastiao Mary Lou
Create a Home Valuation Report for This Property
The Home Valuation Report is an in-depth analysis detailing your home's value as well as a comparison with similar homes in the area
Home Values in the Area
Average Home Value in this Area
Purchase History
| Date | Buyer | Sale Price | Title Company |
|---|---|---|---|
| Weglein Gabrielle | $160,000 | None Available | |
| Rossiter Moira A | $221,500 | -- | |
| Gillette Dena | $180,000 | Chicago Title Insurance Co | |
| Galante Mary Lou | $25,000 | -- |
Source: Public Records
Tax History Compared to Growth
Tax History
| Year | Tax Paid | Tax Assessment Tax Assessment Total Assessment is a certain percentage of the fair market value that is determined by local assessors to be the total taxable value of land and additions on the property. | Land | Improvement |
|---|---|---|---|---|
| 2024 | -- | $563,500 | $212,600 | $350,900 |
| 2023 | -- | $563,500 | $212,600 | $350,900 |
| 2022 | $6,892 | $563,500 | $212,600 | $350,900 |
| 2021 | $6,892 | $563,500 | $212,600 | $350,900 |
| 2020 | $8,091 | $563,500 | $212,600 | $350,900 |
| 2019 | $8,091 | $0 | $0 | $0 |
| 2018 | -- | $548,200 | $212,600 | $335,600 |
| 2017 | $7,169 | $466,000 | $180,700 | $285,300 |
| 2016 | $6,938 | $445,300 | $176,900 | $268,400 |
| 2015 | -- | $445,300 | $176,900 | $268,400 |
| 2014 | -- | $445,300 | $176,900 | $268,400 |
Source: Public Records
Map
Nearby Homes