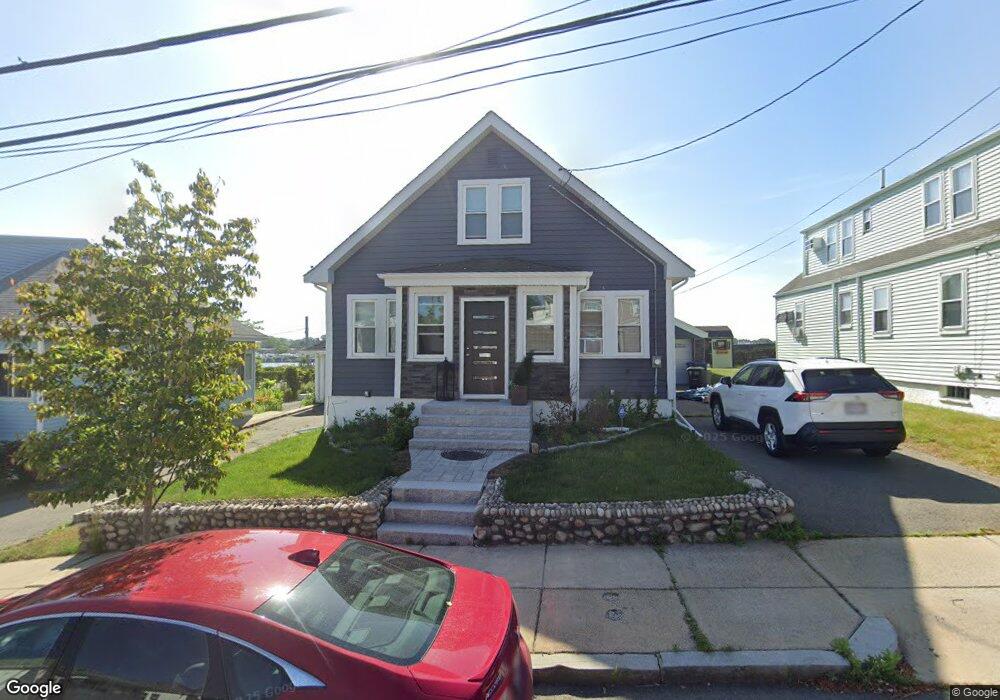
10 Annavoy St Boston, MA 02128
Harbor View-Orient Heights NeighborhoodEstimated Value: $661,017 - $844,000
2
Beds
1
Bath
1,755
Sq Ft
$429/Sq Ft
Est. Value
About This Home
This home is located at 10 Annavoy St, Boston, MA 02128 and is currently estimated at $753,004, approximately $429 per square foot. 10 Annavoy St is a home located in Suffolk County with nearby schools including Excel Academy East Boston, East Boston Montessori School, and Brooke Charter Schools East Boston.
Ownership History
Date
Name
Owned For
Owner Type
Purchase Details
Closed on
Sep 8, 2010
Sold by
Ahern Geraldine F and Norrish Paul R
Bought by
Norrish Geraldine A and Norrish Paul R
Current Estimated Value
Home Financials for this Owner
Home Financials are based on the most recent Mortgage that was taken out on this home.
Original Mortgage
$219,700
Outstanding Balance
$145,883
Interest Rate
4.55%
Mortgage Type
Purchase Money Mortgage
Estimated Equity
$607,121
Purchase Details
Closed on
Jun 13, 2001
Sold by
Cerullo Christie
Bought by
Ahern Geraldine F
Home Financials for this Owner
Home Financials are based on the most recent Mortgage that was taken out on this home.
Original Mortgage
$175,000
Interest Rate
7.15%
Mortgage Type
Purchase Money Mortgage
Create a Home Valuation Report for This Property
The Home Valuation Report is an in-depth analysis detailing your home's value as well as a comparison with similar homes in the area
Home Values in the Area
Average Home Value in this Area
Purchase History
| Date | Buyer | Sale Price | Title Company |
|---|---|---|---|
| Norrish Geraldine A | -- | -- | |
| Ahern Geraldine F | $185,000 | -- |
Source: Public Records
Mortgage History
| Date | Status | Borrower | Loan Amount |
|---|---|---|---|
| Open | Norrish Geraldine A | $219,700 | |
| Previous Owner | Ahern Geraldine F | $235,000 | |
| Previous Owner | Ahern Geraldine F | $173,000 | |
| Previous Owner | Ahern Geraldine F | $175,000 |
Source: Public Records
Tax History Compared to Growth
Tax History
| Year | Tax Paid | Tax Assessment Tax Assessment Total Assessment is a certain percentage of the fair market value that is determined by local assessors to be the total taxable value of land and additions on the property. | Land | Improvement |
|---|---|---|---|---|
| 2025 | $6,606 | $570,500 | $252,900 | $317,600 |
| 2024 | $6,628 | $608,100 | $212,600 | $395,500 |
| 2023 | $6,105 | $568,400 | $198,700 | $369,700 |
| 2022 | $6,004 | $551,800 | $192,900 | $358,900 |
| 2021 | $5,888 | $551,800 | $192,900 | $358,900 |
| 2020 | $4,807 | $455,200 | $193,000 | $262,200 |
| 2019 | $4,267 | $404,800 | $148,900 | $255,900 |
| 2018 | $3,857 | $368,000 | $148,900 | $219,100 |
| 2017 | $3,516 | $332,000 | $148,900 | $183,100 |
| 2016 | $3,652 | $332,000 | $148,900 | $183,100 |
| 2015 | $3,482 | $287,500 | $114,600 | $172,900 |
| 2014 | $3,288 | $261,400 | $114,600 | $146,800 |
Source: Public Records
Map
Nearby Homes
- 5 Nancia St Unit 2
- 20 Nancia St
- 56 Main St
- 29 St Andrew Rd Unit 1
- 550 Pleasant St Unit 11D
- 550 Pleasant St Unit 506
- 14 Pleasant Park Rd
- 19 Pleasant Park Rd
- 1044 Saratoga St Unit 1
- 1203 Bennington St
- 1030 Bennington St Unit 15
- 9 Marshall St
- 2 Ford St
- 70 Edgehill Rd
- 49 Faywood Ave
- 970 Saratoga St
- 36A Leyden St
- 16 Boardman St Unit 105
- 9 Atlantic St Unit 2
- 92 Waldemar Ave
- 14 Annavoy St
- 1201 Saratoga St
- 20 Annavoy St
- 156 Saint Andrew Rd
- 156 St Andrews Rd
- 1197 Saratoga St Unit 1199
- 1197-1199 Saratoga St
- 1197 Saratoga St Unit 2
- 1197 Saratoga St Unit 1
- 26 Annavoy St
- 1193 Saratoga St
- 154 Saint Andrew Rd
- 147 Saint Andrew Rd
- 1189 Saratoga St Unit 1191
- 1189-1191 Saratoga St
- 152 St Andrew Rd
- 152 Saint Andrew Rd
- 30 Annavoy St
- 1187 Saratoga St
- 1187 Saratoga St Unit 2