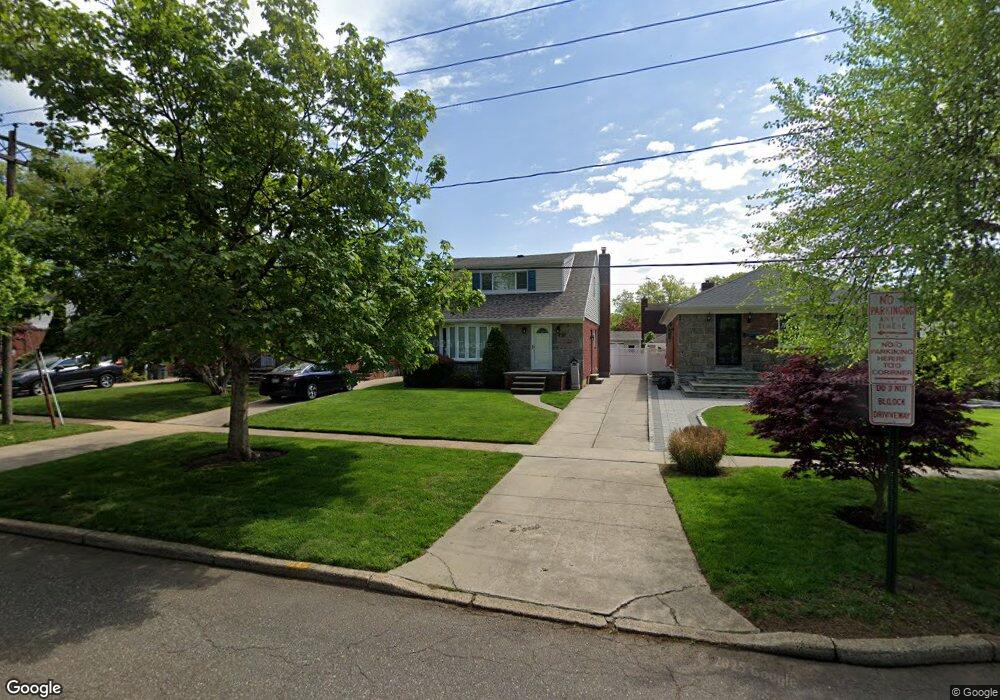
10 Dover Pkwy N Garden City, NY 11530
Estimated Value: $800,842 - $862,000
3
Beds
2
Baths
1,365
Sq Ft
$609/Sq Ft
Est. Value
About This Home
This home is located at 10 Dover Pkwy N, Garden City, NY 11530 and is currently estimated at $831,421, approximately $609 per square foot. 10 Dover Pkwy N is a home located in Nassau County with nearby schools including St Anne's School and Our Lady Of Victory School.
Ownership History
Date
Name
Owned For
Owner Type
Purchase Details
Closed on
Feb 26, 2019
Sold by
Hernandez Sofia and Hernandez Libardo
Bought by
Zgaljardic Maryann
Current Estimated Value
Home Financials for this Owner
Home Financials are based on the most recent Mortgage that was taken out on this home.
Original Mortgage
$265,000
Outstanding Balance
$232,980
Interest Rate
4.4%
Mortgage Type
New Conventional
Estimated Equity
$598,441
Purchase Details
Closed on
Jun 25, 2012
Sold by
Hernandez Libardo and Hernandez Sofia
Bought by
Hernandez Libardo and Hernandez Sofia
Home Financials for this Owner
Home Financials are based on the most recent Mortgage that was taken out on this home.
Original Mortgage
$13,293
Interest Rate
3.78%
Purchase Details
Closed on
Apr 25, 2002
Sold by
Avalos Mariella I and Avalos Anita I
Bought by
Hermander Sofia
Create a Home Valuation Report for This Property
The Home Valuation Report is an in-depth analysis detailing your home's value as well as a comparison with similar homes in the area
Home Values in the Area
Average Home Value in this Area
Purchase History
| Date | Buyer | Sale Price | Title Company |
|---|---|---|---|
| Zgaljardic Maryann | $665,000 | Advantage Title | |
| Hernandez Libardo | -- | -- | |
| Hermander Sofia | $345,000 | Archie Chang |
Source: Public Records
Mortgage History
| Date | Status | Borrower | Loan Amount |
|---|---|---|---|
| Open | Zgaljardic Maryann | $265,000 | |
| Previous Owner | Hernandez Libardo | $13,293 |
Source: Public Records
Tax History Compared to Growth
Tax History
| Year | Tax Paid | Tax Assessment Tax Assessment Total Assessment is a certain percentage of the fair market value that is determined by local assessors to be the total taxable value of land and additions on the property. | Land | Improvement |
|---|---|---|---|---|
| 2025 | $11,187 | $532 | $259 | $273 |
| 2024 | $1,995 | $532 | $259 | $273 |
| 2023 | $9,342 | $532 | $259 | $273 |
| 2022 | $9,342 | $532 | $259 | $273 |
| 2021 | $11,825 | $602 | $246 | $356 |
| 2020 | $10,063 | $653 | $605 | $48 |
| 2019 | $1,743 | $699 | $607 | $92 |
| 2018 | $1,780 | $746 | $0 | $0 |
| 2017 | $6,275 | $779 | $648 | $131 |
| 2016 | $8,054 | $779 | $561 | $218 |
| 2015 | $1,745 | $779 | $561 | $218 |
| 2014 | $1,745 | $779 | $561 | $218 |
| 2013 | $1,876 | $900 | $648 | $252 |
Source: Public Records
Map
Nearby Homes