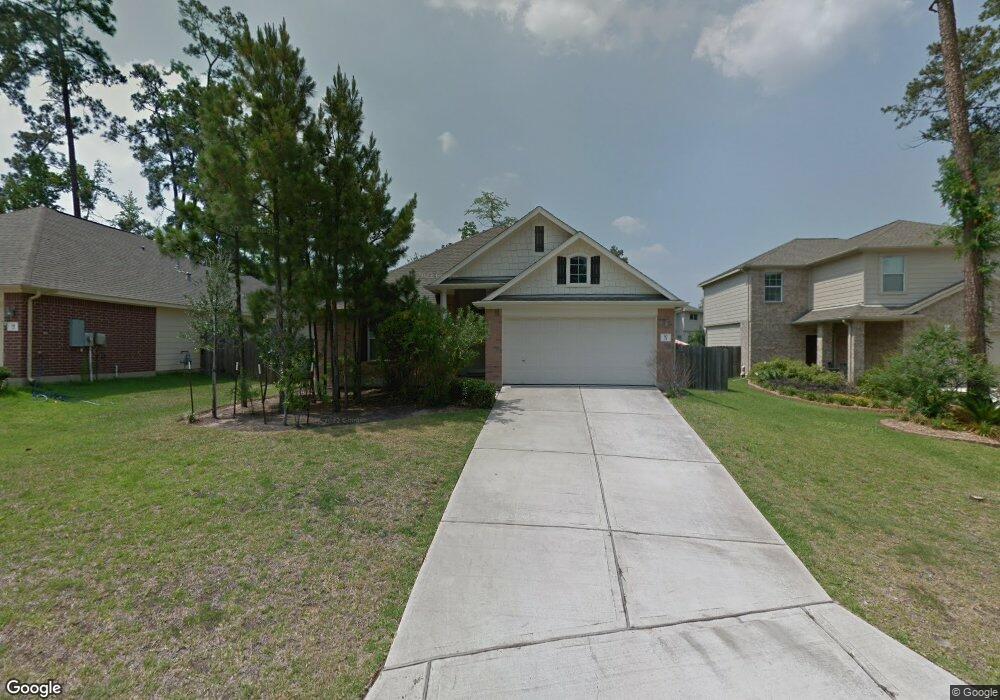
10 E Sage Creek Place Spring, TX 77382
Sterling Ridge NeighborhoodEstimated Value: $350,910 - $418,000
4
Beds
2
Baths
1,833
Sq Ft
$214/Sq Ft
Est. Value
About This Home
This home is located at 10 E Sage Creek Place, Spring, TX 77382 and is currently estimated at $391,478, approximately $213 per square foot. 10 E Sage Creek Place is a home located in Montgomery County with nearby schools including Deretchin Elementary School, McCullough Junior High School, and The Woodlands High School.
Ownership History
Date
Name
Owned For
Owner Type
Purchase Details
Closed on
Oct 26, 2017
Sold by
Svetlana Gezalov Murad and Svetlana Gezalova
Bought by
Jones Matthew and Pitchford Jones Shannan
Current Estimated Value
Home Financials for this Owner
Home Financials are based on the most recent Mortgage that was taken out on this home.
Original Mortgage
$231,725
Outstanding Balance
$193,814
Interest Rate
3.78%
Mortgage Type
FHA
Estimated Equity
$197,664
Purchase Details
Closed on
Jun 5, 2017
Sold by
Nunez Luiz C and Nunez Laura Marcela
Bought by
Gezalov Murad
Purchase Details
Closed on
Feb 27, 2006
Sold by
Mhi Partnership Ltd
Bought by
Nunez Luis C
Home Financials for this Owner
Home Financials are based on the most recent Mortgage that was taken out on this home.
Original Mortgage
$136,300
Interest Rate
6.32%
Mortgage Type
Purchase Money Mortgage
Purchase Details
Closed on
Sep 28, 2005
Sold by
Woodlands Land Dev Lp
Bought by
Gezalov Murad
Create a Home Valuation Report for This Property
The Home Valuation Report is an in-depth analysis detailing your home's value as well as a comparison with similar homes in the area
Home Values in the Area
Average Home Value in this Area
Purchase History
| Date | Buyer | Sale Price | Title Company |
|---|---|---|---|
| Jones Matthew | -- | None Available | |
| Gezalov Murad | -- | Attorney | |
| Nunez Luis C | -- | Millennium Title Houston | |
| Gezalov Murad | -- | -- |
Source: Public Records
Mortgage History
| Date | Status | Borrower | Loan Amount |
|---|---|---|---|
| Open | Jones Matthew | $231,725 | |
| Previous Owner | Nunez Luis C | $136,300 |
Source: Public Records
Tax History Compared to Growth
Tax History
| Year | Tax Paid | Tax Assessment Tax Assessment Total Assessment is a certain percentage of the fair market value that is determined by local assessors to be the total taxable value of land and additions on the property. | Land | Improvement |
|---|---|---|---|---|
| 2025 | $4,127 | $327,946 | -- | -- |
| 2024 | $3,680 | $298,133 | -- | -- |
| 2023 | $3,680 | $271,030 | $50,000 | $288,370 |
| 2022 | $4,979 | $246,390 | $50,000 | $239,110 |
| 2021 | $4,887 | $223,990 | $36,030 | $187,960 |
| 2020 | $5,340 | $234,430 | $36,030 | $198,400 |
| 2019 | $5,510 | $234,050 | $36,030 | $198,020 |
| 2018 | $4,545 | $220,760 | $36,030 | $184,730 |
| 2017 | $5,356 | $224,690 | $36,030 | $188,660 |
| 2016 | $5,355 | $224,690 | $36,030 | $188,660 |
| 2015 | $4,835 | $235,790 | $36,030 | $199,760 |
| 2014 | $4,835 | $200,030 | $36,030 | $164,000 |
Source: Public Records
Map
Nearby Homes
- 146 S Star Ridge Cir
- 158 S Star Ridge Cir
- 10 Barker Ridge Ct
- 35 N Star Ridge Cir
- 2 Craven Park Ct
- 51 N Scribewood Cir
- 163 N Hawkhurst Cir
- 166 Hawkhurst Cir
- 30 Black Swan Ct
- 30 N Scribewood Cir
- 78 S Bardsbrook Cir
- 31 N Spinning Wheel Cir
- 115 Black Swan Place
- 14 Cordella Place
- 166 Black Swan Place
- 14 Trailing Lantana Place
- 8618 Blueberry Ash St
- 8610 Blueberry Ash St
- 119 Benedict Canyon Loop
- 8611 Blueberry Ash St
- 14 E Sage Creek Place
- 6 E Sage Creek Place
- 18 E Sage Creek Place
- 134 S Star Ridge Cir
- 2 E Sage Creek Place
- 126 S Star Ridge Cir
- 130 S Star Ridge Cir
- 138 S Star Ridge Cir
- 11 E Sage Creek Place
- 15 E Sage Creek Place
- 19 E Sage Creek Place
- 7 E Sage Creek Place
- 142 S Star Ridge Cir
- 3 E Sage Creek Place
- 22 W Sage Creek Place
- 118 S Star Ridge Cir
- 23 W Sage Creek Place
- 139 S Star Ridge Cir
- 26 W Sage Creek Place
- 26 W Sage Creek Place