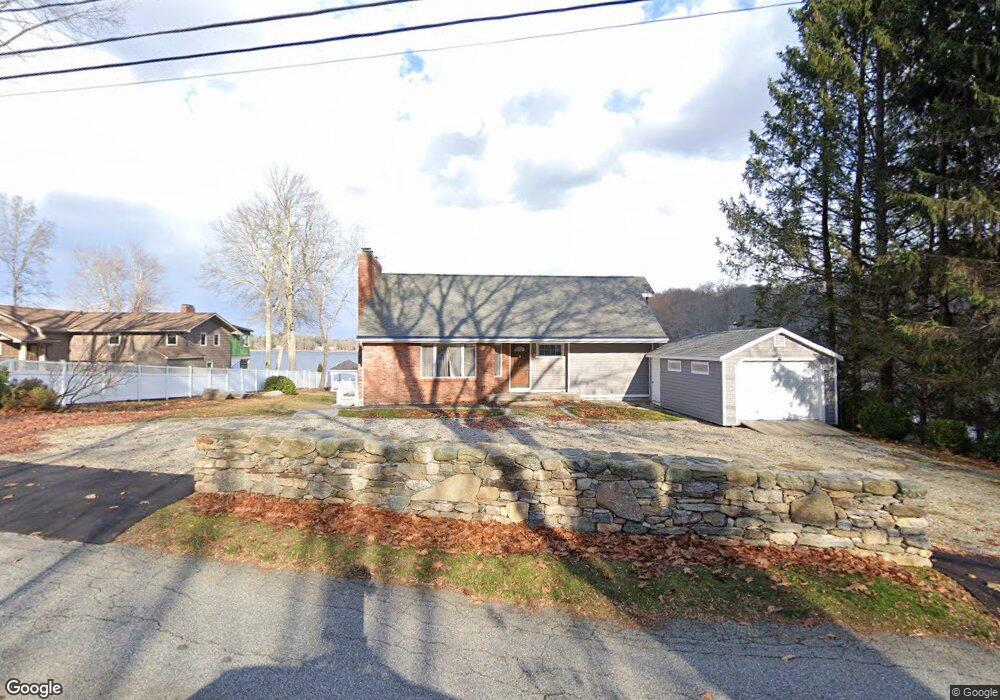
10 Erdoni Rd Columbia, CT 06237
Estimated Value: $699,168 - $1,043,000
3
Beds
3
Baths
1,530
Sq Ft
$568/Sq Ft
Est. Value
About This Home
This home is located at 10 Erdoni Rd, Columbia, CT 06237 and is currently estimated at $869,723, approximately $568 per square foot. 10 Erdoni Rd is a home located in Tolland County with nearby schools including Horace W. Porter School.
Ownership History
Date
Name
Owned For
Owner Type
Purchase Details
Closed on
May 30, 2019
Sold by
Goslin Beverly A
Bought by
Gustafson Todd
Current Estimated Value
Purchase Details
Closed on
Jul 27, 2001
Sold by
Est Horn Samuel and Horn Norman
Bought by
Roy Ryan and Roy Beverly
Home Financials for this Owner
Home Financials are based on the most recent Mortgage that was taken out on this home.
Original Mortgage
$250,000
Interest Rate
7.18%
Create a Home Valuation Report for This Property
The Home Valuation Report is an in-depth analysis detailing your home's value as well as a comparison with similar homes in the area
Home Values in the Area
Average Home Value in this Area
Purchase History
| Date | Buyer | Sale Price | Title Company |
|---|---|---|---|
| Gustafson Todd | $550,000 | -- | |
| Roy Ryan | $346,000 | -- |
Source: Public Records
Mortgage History
| Date | Status | Borrower | Loan Amount |
|---|---|---|---|
| Open | Roy Ryan | $265,000 | |
| Closed | Roy Ryan | $175,000 | |
| Previous Owner | Roy Ryan | $210,000 | |
| Previous Owner | Roy Ryan | $250,000 |
Source: Public Records
Tax History Compared to Growth
Tax History
| Year | Tax Paid | Tax Assessment Tax Assessment Total Assessment is a certain percentage of the fair market value that is determined by local assessors to be the total taxable value of land and additions on the property. | Land | Improvement |
|---|---|---|---|---|
| 2025 | $11,365 | $388,290 | $226,660 | $161,630 |
| 2024 | $10,919 | $388,290 | $226,660 | $161,630 |
| 2023 | $10,061 | $388,290 | $226,660 | $161,630 |
| 2022 | $10,045 | $388,290 | $226,660 | $161,630 |
| 2021 | $10,028 | $341,900 | $232,300 | $109,600 |
| 2020 | $10,286 | $350,700 | $232,300 | $118,400 |
| 2019 | $10,286 | $350,700 | $232,300 | $118,400 |
| 2018 | $10,286 | $350,700 | $232,300 | $118,400 |
| 2017 | $10,128 | $350,700 | $232,300 | $118,400 |
| 2016 | $9,555 | $348,200 | $232,300 | $115,900 |
| 2015 | $9,447 | $348,200 | $232,300 | $115,900 |
| 2014 | $9,447 | $348,200 | $232,300 | $115,900 |
Source: Public Records
Map
Nearby Homes