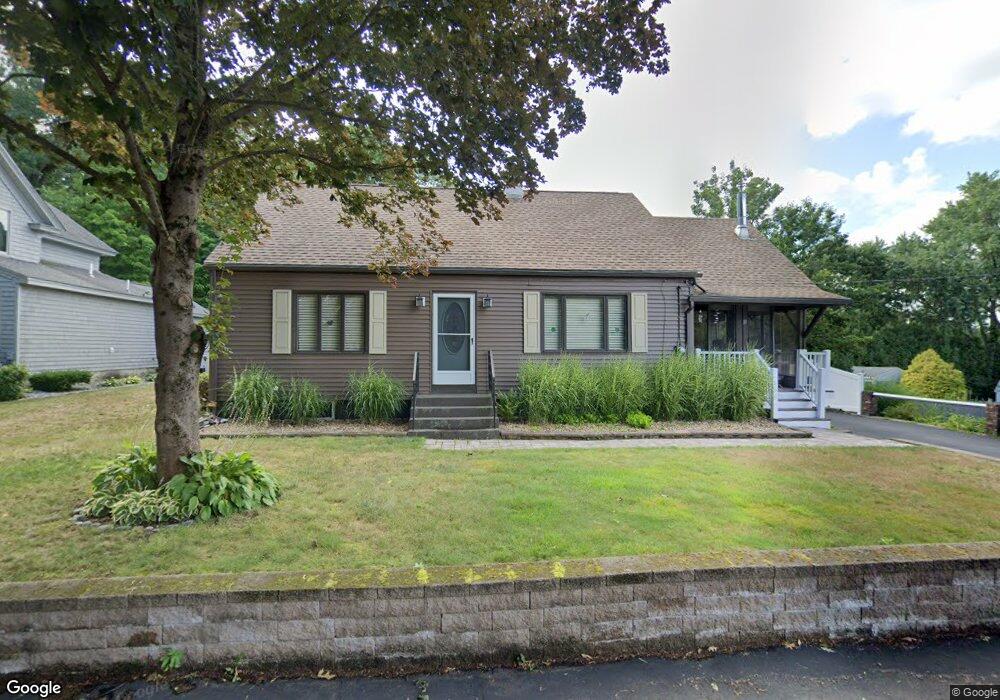
10 Farnum St South Grafton, MA 01560
Estimated Value: $451,000 - $567,000
3
Beds
2
Baths
1,628
Sq Ft
$312/Sq Ft
Est. Value
About This Home
This home is located at 10 Farnum St, South Grafton, MA 01560 and is currently estimated at $507,428, approximately $311 per square foot. 10 Farnum St is a home located in Worcester County with nearby schools including Grafton High School and Silver Spruce Montessori School.
Ownership History
Date
Name
Owned For
Owner Type
Purchase Details
Closed on
May 22, 2020
Sold by
Cournoyer Robert P and Cournoyer Carolyn J
Bought by
Cournoyer Irt and Cournoyer
Current Estimated Value
Purchase Details
Closed on
Oct 23, 1968
Bought by
Cournoyer Robert P and Cournoyer Carolyn J
Create a Home Valuation Report for This Property
The Home Valuation Report is an in-depth analysis detailing your home's value as well as a comparison with similar homes in the area
Home Values in the Area
Average Home Value in this Area
Purchase History
| Date | Buyer | Sale Price | Title Company |
|---|---|---|---|
| Cournoyer Irt | -- | None Available | |
| Cournoyer Irt | -- | None Available | |
| Cournoyer Irt | -- | None Available | |
| Cournoyer Robert P | -- | -- |
Source: Public Records
Mortgage History
| Date | Status | Borrower | Loan Amount |
|---|---|---|---|
| Previous Owner | Cournoyer Robert P | $18,000 | |
| Previous Owner | Cournoyer Robert P | $71,000 |
Source: Public Records
Tax History Compared to Growth
Tax History
| Year | Tax Paid | Tax Assessment Tax Assessment Total Assessment is a certain percentage of the fair market value that is determined by local assessors to be the total taxable value of land and additions on the property. | Land | Improvement |
|---|---|---|---|---|
| 2025 | $6,799 | $487,700 | $167,100 | $320,600 |
| 2024 | $6,706 | $468,600 | $159,100 | $309,500 |
| 2023 | $6,392 | $406,900 | $159,100 | $247,800 |
| 2022 | $6,133 | $363,300 | $136,600 | $226,700 |
| 2021 | $5,949 | $346,300 | $124,100 | $222,200 |
| 2020 | $5,681 | $344,300 | $124,100 | $220,200 |
| 2019 | $5,125 | $307,600 | $120,500 | $187,100 |
| 2018 | $4,934 | $297,400 | $119,900 | $177,500 |
| 2017 | $4,761 | $290,300 | $112,800 | $177,500 |
| 2016 | $4,316 | $257,700 | $90,600 | $167,100 |
| 2015 | $4,264 | $258,400 | $89,500 | $168,900 |
| 2014 | $4,053 | $265,600 | $105,800 | $159,800 |
Source: Public Records
Map
Nearby Homes
- 7 Pine Hill Rd
- 109 Main St
- 110 Main St
- 58 Fisherville Terrace
- 44 Fisherville Terrace
- 55 Fisherville Terrace
- 185 Main St
- 29 Sampson St Unit 29
- 50 Highland View Dr
- 90 Leland Hill Rd
- 191 Hartness Rd
- 115 Ariel Cir
- 29 Highland View Dr
- 19 Wildflower Dr
- 150 Ariel Cir
- 7 B Herbert Dr Unit 14
- 5 Wildflower Dr
- 151 Providence Rd Unit 24
- 13 Pullard Rd Unit 38
- 29 Pullard Rd
- 8 Farnum St
- 12 Farnum St
- 9 Desrosiers Landing
- 9 Farnum St
- 6 Farnum St
- 144 Main St
- 7 Desrosiers Landing
- 8 Desrosiers Landing
- 124 Main St
- 124 Main St Unit B
- 124 Main
- 14 Farnum St
- 7 Farnum St
- 20 Murray Ave
- 4 Farnum St
- 5 Desrosiers Landing
- 6 Desrosiers Landing
- 127 Main St
- 16 Murray Ave
- 4 Desrosiers Landing