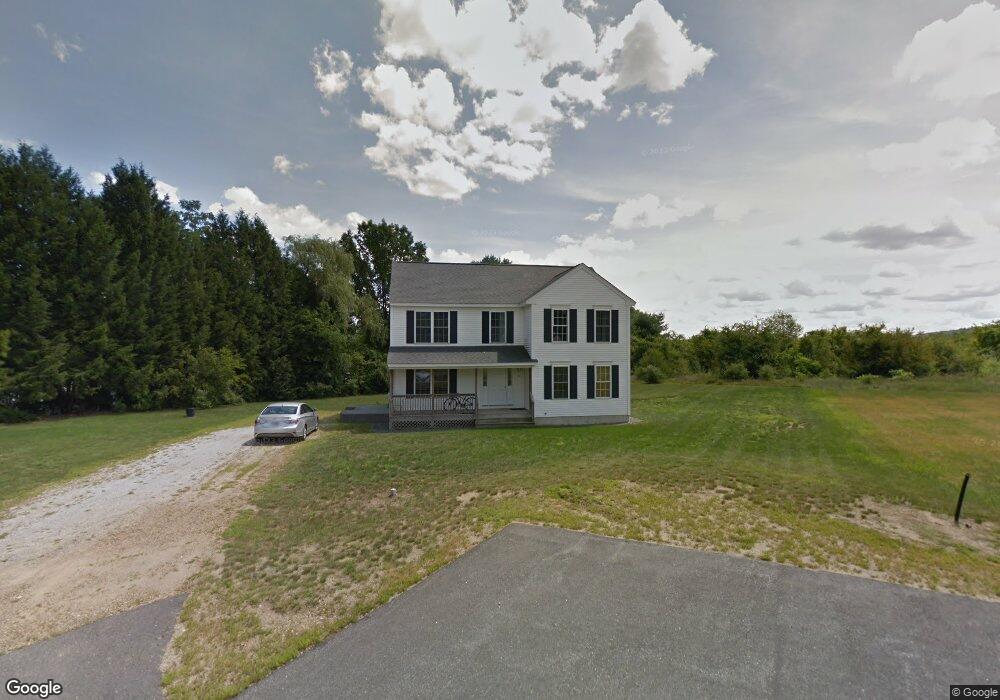
10 Glen Falls Rd Franklin, NH 03235
Estimated Value: $450,000 - $544,000
3
Beds
3
Baths
2,291
Sq Ft
$214/Sq Ft
Est. Value
About This Home
This home is located at 10 Glen Falls Rd, Franklin, NH 03235 and is currently estimated at $489,615, approximately $213 per square foot. 10 Glen Falls Rd is a home located in Merrimack County with nearby schools including Paul A. Smith School, Franklin Middle School, and Franklin High School.
Ownership History
Date
Name
Owned For
Owner Type
Purchase Details
Closed on
Jul 30, 2007
Sold by
B & B Designs Llc
Bought by
Bradley Stephen
Current Estimated Value
Home Financials for this Owner
Home Financials are based on the most recent Mortgage that was taken out on this home.
Original Mortgage
$234,344
Outstanding Balance
$147,916
Interest Rate
6.78%
Mortgage Type
Purchase Money Mortgage
Estimated Equity
$341,699
Create a Home Valuation Report for This Property
The Home Valuation Report is an in-depth analysis detailing your home's value as well as a comparison with similar homes in the area
Home Values in the Area
Average Home Value in this Area
Purchase History
| Date | Buyer | Sale Price | Title Company |
|---|---|---|---|
| Bradley Stephen | $233,400 | -- |
Source: Public Records
Mortgage History
| Date | Status | Borrower | Loan Amount |
|---|---|---|---|
| Open | Bradley Stephen | $234,344 | |
| Previous Owner | Bradley Stephen | $213,600 |
Source: Public Records
Tax History Compared to Growth
Tax History
| Year | Tax Paid | Tax Assessment Tax Assessment Total Assessment is a certain percentage of the fair market value that is determined by local assessors to be the total taxable value of land and additions on the property. | Land | Improvement |
|---|---|---|---|---|
| 2024 | $6,935 | $404,400 | $104,500 | $299,900 |
| 2023 | $6,436 | $395,800 | $104,500 | $291,300 |
| 2022 | $5,795 | $237,600 | $83,600 | $154,000 |
| 2021 | $5,515 | $237,600 | $83,600 | $154,000 |
| 2020 | $5,251 | $229,900 | $83,600 | $146,300 |
| 2019 | $5,150 | $229,200 | $82,900 | $146,300 |
| 2018 | $5,033 | $229,200 | $82,900 | $146,300 |
| 2017 | $4,478 | $175,200 | $34,800 | $140,400 |
| 2016 | $4,471 | $177,200 | $34,800 | $142,400 |
| 2015 | $3,095 | $124,040 | $24,360 | $99,680 |
| 2011 | $4,739 | $220,200 | $43,700 | $176,500 |
Source: Public Records
Map
Nearby Homes