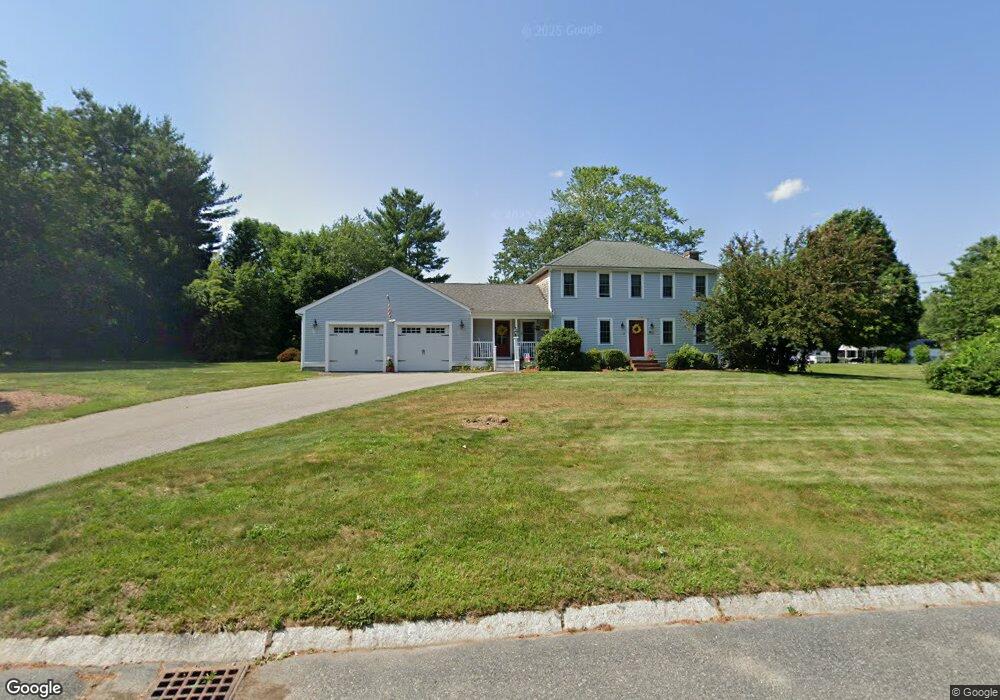
10 Kathleen Rd Bridgewater, MA 02324
Estimated Value: $596,000 - $735,000
3
Beds
2
Baths
1,500
Sq Ft
$456/Sq Ft
Est. Value
About This Home
This home is located at 10 Kathleen Rd, Bridgewater, MA 02324 and is currently estimated at $684,477, approximately $456 per square foot. 10 Kathleen Rd is a home located in Plymouth County with nearby schools including Mitchell Elementary School, Williams Intermediate School, and Bridgewater Middle School.
Ownership History
Date
Name
Owned For
Owner Type
Purchase Details
Closed on
Jul 28, 1998
Sold by
Sullivan Patrick and Sullivan Michelle
Bought by
Moyninhan Peter P and Moyninhan Brenda L
Current Estimated Value
Purchase Details
Closed on
Jan 4, 1995
Sold by
Montgomery Robert E and Montgomery Arthur R
Bought by
Goscon Inc
Purchase Details
Closed on
Dec 18, 1991
Sold by
C & C Rt
Bought by
Sullivan Patrick and Sullivan Michelle
Create a Home Valuation Report for This Property
The Home Valuation Report is an in-depth analysis detailing your home's value as well as a comparison with similar homes in the area
Home Values in the Area
Average Home Value in this Area
Purchase History
| Date | Buyer | Sale Price | Title Company |
|---|---|---|---|
| Moyninhan Peter P | $179,900 | -- | |
| Goscon Inc | $175,000 | -- | |
| Sullivan Patrick | $149,800 | -- |
Source: Public Records
Mortgage History
| Date | Status | Borrower | Loan Amount |
|---|---|---|---|
| Open | Sullivan Patrick | $301,000 | |
| Closed | Sullivan Patrick | $25,000 |
Source: Public Records
Tax History Compared to Growth
Tax History
| Year | Tax Paid | Tax Assessment Tax Assessment Total Assessment is a certain percentage of the fair market value that is determined by local assessors to be the total taxable value of land and additions on the property. | Land | Improvement |
|---|---|---|---|---|
| 2025 | $7,530 | $636,500 | $236,500 | $400,000 |
| 2024 | $7,373 | $607,300 | $225,200 | $382,100 |
| 2023 | $7,125 | $554,900 | $210,500 | $344,400 |
| 2022 | $6,978 | $487,300 | $184,700 | $302,600 |
| 2021 | $5,640 | $389,500 | $164,900 | $224,600 |
| 2020 | $5,519 | $374,700 | $158,500 | $216,200 |
| 2019 | $5,407 | $364,600 | $158,500 | $206,100 |
| 2018 | $5,258 | $344,000 | $154,000 | $190,000 |
| 2017 | $5,056 | $323,900 | $154,000 | $169,900 |
| 2016 | $4,848 | $312,000 | $151,000 | $161,000 |
| 2015 | $4,880 | $300,500 | $146,500 | $154,000 |
| 2014 | $4,773 | $293,700 | $142,200 | $151,500 |
Source: Public Records
Map
Nearby Homes
- 465-475 Laurel St
- 317 Water St
- 218 Auburn St
- 0 Flagg St Unit 73421818
- 45 Edge Hill Dr Unit 47
- 125 Walnut St
- 49 Orange St
- 865 Plymouth St Unit 865
- 9 Titicut Ave
- The Fenway Plan at Duxburrow Estates
- The Deerfield Plan at Duxburrow Estates
- The Cambria Plan at Duxburrow Estates
- The Fairfield Plan at Duxburrow Estates
- The Broadway Plan at Duxburrow Estates
- The Chaves Plan at Duxburrow Estates
- The Newton Plan at Duxburrow Estates
- The Camden Plan at Duxburrow Estates
- The Newton Grand Plan at Duxburrow Estates
- The Beacon Plan at Duxburrow Estates
- The Clarendon Plan at Duxburrow Estates