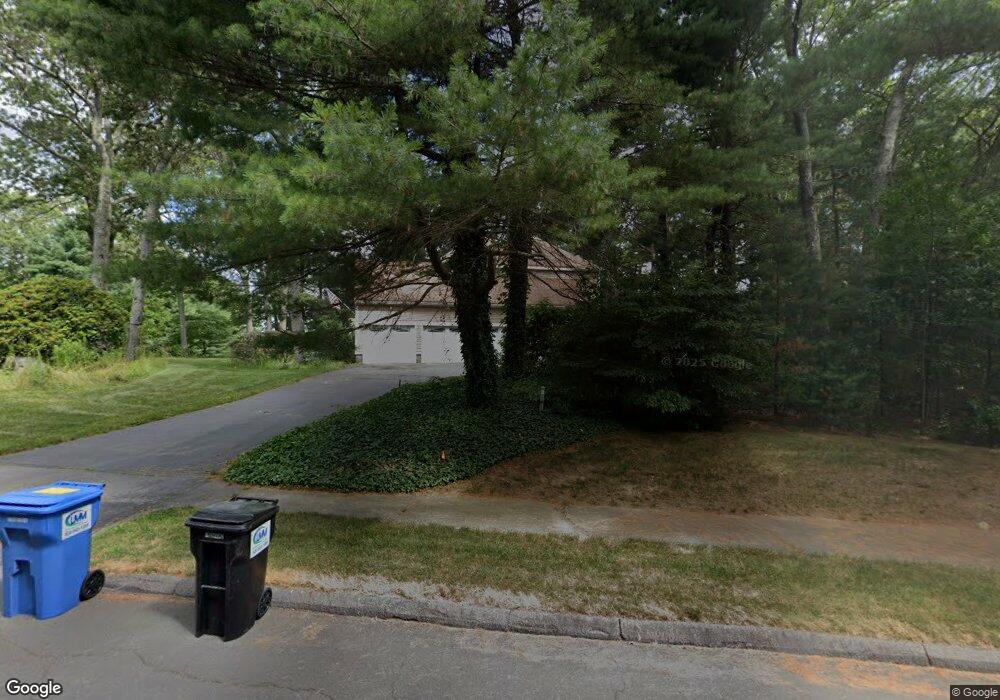
10 Mary Way Foxboro, MA 02035
Estimated Value: $1,194,000 - $1,391,000
4
Beds
3
Baths
4,431
Sq Ft
$296/Sq Ft
Est. Value
About This Home
This home is located at 10 Mary Way, Foxboro, MA 02035 and is currently estimated at $1,311,600, approximately $296 per square foot. 10 Mary Way is a home located in Norfolk County with nearby schools including Foxborough High School, Foxborough Regional Charter School, and Hands-On-Montessori School.
Ownership History
Date
Name
Owned For
Owner Type
Purchase Details
Closed on
Oct 30, 2023
Sold by
Weiss Carolyn J
Bought by
Austin Michelle M and Weiss Monique M
Current Estimated Value
Purchase Details
Closed on
Mar 11, 1993
Sold by
Autumn Rt
Bought by
Weiss Roger E J and Weiss Carolyn J
Create a Home Valuation Report for This Property
The Home Valuation Report is an in-depth analysis detailing your home's value as well as a comparison with similar homes in the area
Home Values in the Area
Average Home Value in this Area
Purchase History
| Date | Buyer | Sale Price | Title Company |
|---|---|---|---|
| Austin Michelle M | -- | None Available | |
| Weiss Roger E J | $103,400 | -- |
Source: Public Records
Mortgage History
| Date | Status | Borrower | Loan Amount |
|---|---|---|---|
| Previous Owner | Weiss Roger E J | $300,000 | |
| Previous Owner | Weiss Roger E J | $274,000 |
Source: Public Records
Tax History Compared to Growth
Tax History
| Year | Tax Paid | Tax Assessment Tax Assessment Total Assessment is a certain percentage of the fair market value that is determined by local assessors to be the total taxable value of land and additions on the property. | Land | Improvement |
|---|---|---|---|---|
| 2025 | $15,526 | $1,174,400 | $314,400 | $860,000 |
| 2024 | $14,792 | $1,094,900 | $288,200 | $806,700 |
| 2023 | $14,018 | $986,500 | $274,600 | $711,900 |
| 2022 | $13,485 | $928,700 | $256,300 | $672,400 |
| 2021 | $13,427 | $910,900 | $249,800 | $661,100 |
| 2020 | $12,943 | $888,300 | $249,800 | $638,500 |
| 2019 | $12,867 | $875,300 | $268,800 | $606,500 |
| 2018 | $12,456 | $854,900 | $279,200 | $575,700 |
| 2017 | $12,134 | $806,800 | $270,500 | $536,300 |
| 2016 | $12,059 | $813,700 | $265,800 | $547,900 |
| 2015 | $11,989 | $789,300 | $212,500 | $576,800 |
| 2014 | $11,658 | $777,700 | $212,500 | $565,200 |
Source: Public Records
Map
Nearby Homes
- 406 South St
- 80 Mill St
- 16 Treasure Island Rd
- 450 West St
- 356 Central St
- 12 Spring St
- 24 Maverick Dr
- 9 Oak Dr
- 166 Chauncy St
- 483 Thurston St
- 4 Buckskin Dr
- 11 W Belcher Rd Unit 2
- 120 Hawes St
- 14 Baker St
- 11 Orchard Place Unit 11
- 24 Mechanic St
- 231 Spring St
- 84 Cocasset St Unit A6
- 28 Angell St
- 18 Winter St Unit E