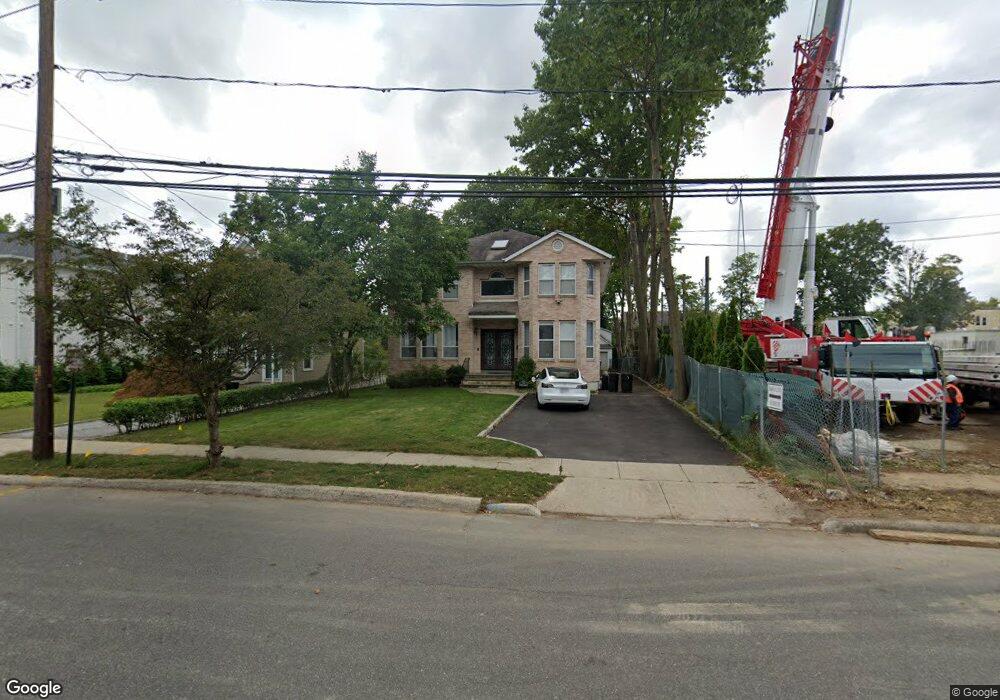
10 North Rd Great Neck, NY 11024
Estimated Value: $1,031,000 - $1,481,224
--
Bed
4
Baths
3,054
Sq Ft
$411/Sq Ft
Est. Value
About This Home
This home is located at 10 North Rd, Great Neck, NY 11024 and is currently estimated at $1,256,112, approximately $411 per square foot. 10 North Rd is a home located in Nassau County with nearby schools including John F Kennedy School, Richard S. Sherman - Great Neck North Middle School, and John L. Miller Great Neck North High School.
Ownership History
Date
Name
Owned For
Owner Type
Purchase Details
Closed on
Nov 2, 2020
Sold by
Kordvani Ronald and Kordvani Mark
Bought by
Kordvani Mark and Kordvani Miriam Dina
Current Estimated Value
Home Financials for this Owner
Home Financials are based on the most recent Mortgage that was taken out on this home.
Original Mortgage
$240,000
Outstanding Balance
$213,566
Interest Rate
2.8%
Mortgage Type
New Conventional
Estimated Equity
$1,042,546
Purchase Details
Closed on
Dec 3, 2012
Sold by
Kordvani Ebrahim
Bought by
Kordvani Ronald and Kordvani Mark
Purchase Details
Closed on
Dec 18, 1997
Sold by
Baradarian Mansour
Bought by
Kordvani Ebrahim
Purchase Details
Closed on
Mar 31, 1997
Sold by
Agabian Louise S
Bought by
Baradarian Mansour
Create a Home Valuation Report for This Property
The Home Valuation Report is an in-depth analysis detailing your home's value as well as a comparison with similar homes in the area
Home Values in the Area
Average Home Value in this Area
Purchase History
| Date | Buyer | Sale Price | Title Company |
|---|---|---|---|
| Kordvani Mark | $700,000 | None Available | |
| Kordvani Ronald | -- | -- | |
| Kordvani Ebrahim | $490,000 | -- | |
| Baradarian Mansour | $250,000 | -- |
Source: Public Records
Mortgage History
| Date | Status | Borrower | Loan Amount |
|---|---|---|---|
| Open | Kordvani Mark | $240,000 |
Source: Public Records
Tax History Compared to Growth
Tax History
| Year | Tax Paid | Tax Assessment Tax Assessment Total Assessment is a certain percentage of the fair market value that is determined by local assessors to be the total taxable value of land and additions on the property. | Land | Improvement |
|---|---|---|---|---|
| 2025 | $18,704 | $1,026 | $355 | $671 |
| 2024 | $5,304 | $1,064 | $369 | $695 |
| 2023 | $16,549 | $1,149 | $398 | $751 |
| 2022 | $16,549 | $1,149 | $398 | $751 |
| 2021 | $14,816 | $1,143 | $396 | $747 |
| 2020 | $13,015 | $1,457 | $1,139 | $318 |
| 2019 | $15,623 | $1,561 | $1,144 | $417 |
| 2018 | $15,623 | $1,665 | $0 | $0 |
| 2017 | $10,659 | $1,769 | $1,072 | $697 |
| 2016 | $15,854 | $2,013 | $1,220 | $793 |
| 2015 | $5,654 | $2,013 | $1,220 | $793 |
| 2014 | $5,654 | $2,013 | $1,220 | $793 |
| 2013 | $5,369 | $2,013 | $1,220 | $793 |
Source: Public Records
Map
Nearby Homes