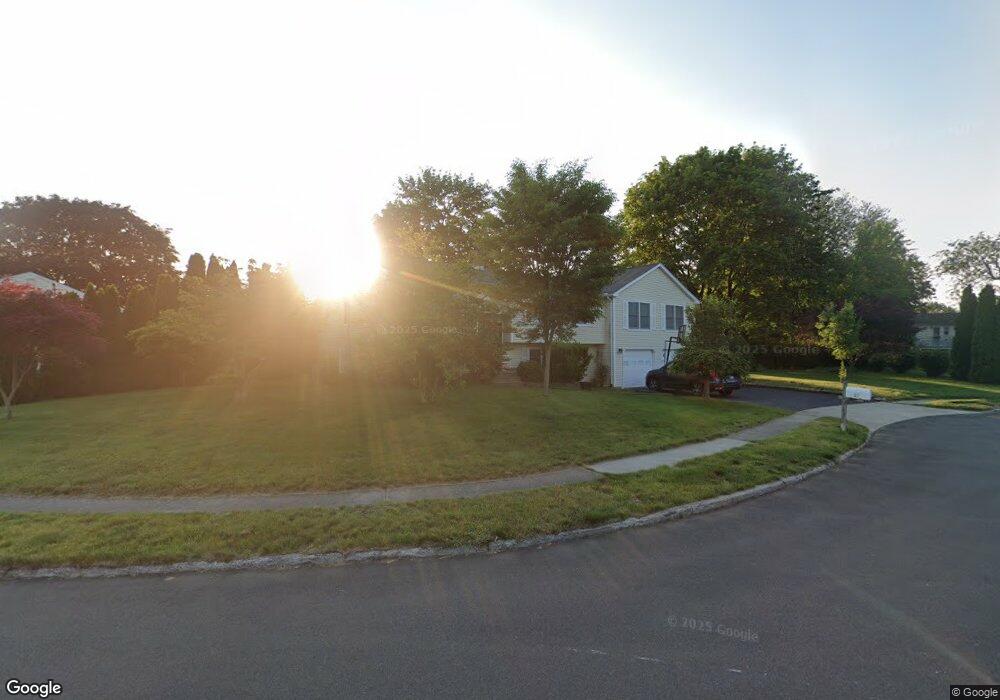
10 Shelley Cir Milford, CT 06460
Woodmont NeighborhoodEstimated Value: $611,000 - $710,000
4
Beds
3
Baths
2,158
Sq Ft
$309/Sq Ft
Est. Value
About This Home
This home is located at 10 Shelley Cir, Milford, CT 06460 and is currently estimated at $666,556, approximately $308 per square foot. 10 Shelley Cir is a home located in New Haven County with nearby schools including Live Oaks School, East Shore Middle School, and Joseph A. Foran High School.
Ownership History
Date
Name
Owned For
Owner Type
Purchase Details
Closed on
Oct 12, 2011
Sold by
Phung Trung Tri
Bought by
Phung Hung
Current Estimated Value
Purchase Details
Closed on
Mar 26, 2001
Sold by
Quinn Versalia
Bought by
Phung Hung P and Lee Jin S
Home Financials for this Owner
Home Financials are based on the most recent Mortgage that was taken out on this home.
Original Mortgage
$130,000
Interest Rate
6.93%
Create a Home Valuation Report for This Property
The Home Valuation Report is an in-depth analysis detailing your home's value as well as a comparison with similar homes in the area
Home Values in the Area
Average Home Value in this Area
Purchase History
| Date | Buyer | Sale Price | Title Company |
|---|---|---|---|
| Phung Hung | $300,000 | -- | |
| Phung Hung | $300,000 | -- | |
| Phung Hung P | $190,000 | -- | |
| Phung Hung P | $190,000 | -- |
Source: Public Records
Mortgage History
| Date | Status | Borrower | Loan Amount |
|---|---|---|---|
| Previous Owner | Phung Hung P | $304,000 | |
| Previous Owner | Phung Hung P | $60,000 | |
| Previous Owner | Phung Hung P | $130,000 |
Source: Public Records
Tax History Compared to Growth
Tax History
| Year | Tax Paid | Tax Assessment Tax Assessment Total Assessment is a certain percentage of the fair market value that is determined by local assessors to be the total taxable value of land and additions on the property. | Land | Improvement |
|---|---|---|---|---|
| 2025 | $9,641 | $326,250 | $116,420 | $209,830 |
| 2024 | $9,507 | $326,250 | $116,420 | $209,830 |
| 2023 | $8,864 | $326,250 | $116,420 | $209,830 |
| 2022 | $8,695 | $326,250 | $116,420 | $209,830 |
| 2021 | $7,497 | $271,130 | $84,340 | $186,790 |
| 2020 | $7,505 | $271,130 | $84,340 | $186,790 |
| 2019 | $7,513 | $271,130 | $84,340 | $186,790 |
| 2018 | $7,521 | $271,130 | $84,340 | $186,790 |
| 2017 | $7,535 | $271,130 | $84,340 | $186,790 |
| 2016 | $7,381 | $265,130 | $84,340 | $180,790 |
| 2015 | $7,392 | $265,130 | $84,340 | $180,790 |
| 2014 | $7,217 | $265,130 | $84,340 | $180,790 |
Source: Public Records
Map
Nearby Homes
- 26 Riverdale Rd
- 28 Live Oaks Rd
- 36 Kenwood Rd
- 44 Columbia Dr
- 30 Salem Walk
- 35 Whippoorwill Dr
- 5 Cora Place
- 40 Hawley Ave
- 11 Marble Ln
- 118 McQuillan Dr
- 123 McQuillan Dr
- 24 Ella
- 25 Belle Cir
- 583 Anderson Ave
- 24 Kaye Rd
- 207 Merwin Ave
- 157 Kings Hwy Unit E
- 152 Beach Ave
- 29 Meetinghouse Ln
- 56 Down Draft Cir