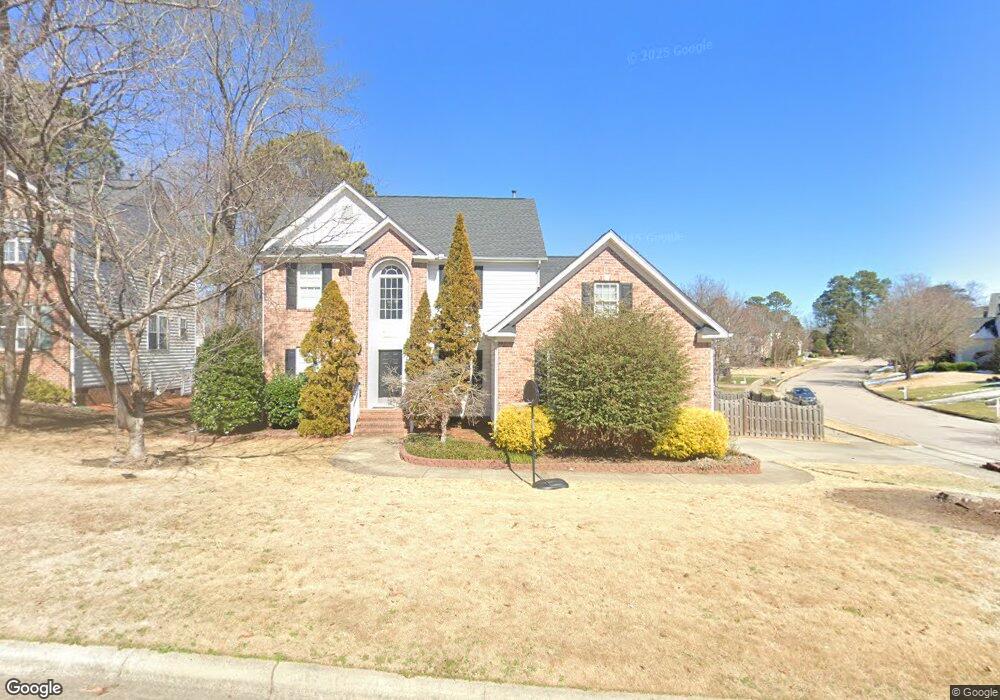
100 Castlebury Creek Ct Cary, NC 27519
West Cary NeighborhoodEstimated Value: $633,000 - $659,000
4
Beds
3
Baths
2,350
Sq Ft
$276/Sq Ft
Est. Value
About This Home
This home is located at 100 Castlebury Creek Ct, Cary, NC 27519 and is currently estimated at $648,067, approximately $275 per square foot. 100 Castlebury Creek Ct is a home located in Wake County with nearby schools including Turner Creek Elementary School, Salem Middle, and Green Hope High.
Ownership History
Date
Name
Owned For
Owner Type
Purchase Details
Closed on
Oct 13, 2017
Sold by
Fernando Thimithri T and Wijesekera Thimithri T
Bought by
Wijesekera Thimithri T and Wijesekera Daluthgamage
Current Estimated Value
Home Financials for this Owner
Home Financials are based on the most recent Mortgage that was taken out on this home.
Original Mortgage
$288,000
Outstanding Balance
$240,303
Interest Rate
3.78%
Mortgage Type
New Conventional
Estimated Equity
$407,764
Purchase Details
Closed on
Feb 1, 2016
Sold by
Galloway Cheryi and Seppanen Cheryi
Bought by
Fernando Thimithri T
Home Financials for this Owner
Home Financials are based on the most recent Mortgage that was taken out on this home.
Original Mortgage
$296,000
Interest Rate
3.92%
Mortgage Type
New Conventional
Purchase Details
Closed on
Jan 28, 2014
Sold by
Seppanen Markus
Bought by
Seppanen Cheryl
Create a Home Valuation Report for This Property
The Home Valuation Report is an in-depth analysis detailing your home's value as well as a comparison with similar homes in the area
Home Values in the Area
Average Home Value in this Area
Purchase History
| Date | Buyer | Sale Price | Title Company |
|---|---|---|---|
| Wijesekera Thimithri T | -- | None Available | |
| Fernando Thimithri T | $317,000 | None Available | |
| Seppanen Cheryl | -- | None Available |
Source: Public Records
Mortgage History
| Date | Status | Borrower | Loan Amount |
|---|---|---|---|
| Open | Wijesekera Thimithri T | $288,000 | |
| Closed | Fernando Thimithri T | $296,000 |
Source: Public Records
Tax History Compared to Growth
Tax History
| Year | Tax Paid | Tax Assessment Tax Assessment Total Assessment is a certain percentage of the fair market value that is determined by local assessors to be the total taxable value of land and additions on the property. | Land | Improvement |
|---|---|---|---|---|
| 2025 | $5,317 | $617,978 | $210,000 | $407,978 |
| 2024 | $5,202 | $617,978 | $210,000 | $407,978 |
| 2023 | $3,748 | $372,067 | $83,000 | $289,067 |
| 2022 | $3,609 | $372,067 | $83,000 | $289,067 |
| 2021 | $3,536 | $372,067 | $83,000 | $289,067 |
| 2020 | $3,555 | $372,067 | $83,000 | $289,067 |
| 2019 | $3,351 | $311,109 | $83,000 | $228,109 |
| 2018 | $3,145 | $311,109 | $83,000 | $228,109 |
| 2017 | $3,022 | $311,109 | $83,000 | $228,109 |
| 2016 | $2,977 | $311,109 | $83,000 | $228,109 |
| 2015 | $3,030 | $305,745 | $78,000 | $227,745 |
| 2014 | $2,857 | $305,745 | $78,000 | $227,745 |
Source: Public Records
Map
Nearby Homes
- 200 Carpenter Brook Dr
- 320 Wedgemere St
- 6716 Valley Woods Ln
- 205 Wedgemere St
- 100 Wentbridge Rd
- 120 Union Mills Way
- 103 Town Creek Dr
- 112 Amiable Loop
- 307 Sir Brennan Ct
- 320 Sutton Glen Dr
- 209 Parkmeadow Dr
- 112 Rapport Dr
- 313 Alliance Cir
- 203 Caraway Ln
- 2021 Patapsco Dr
- 424 Euphoria Cir
- 105 Point Harbor Dr
- 712 Oak Ridge Dr
- 713 Oak Ridge Dr
- 322 Parkmeadow Dr
- 102 Castlebury Creek Ct
- 406 Fryar Creek Dr
- 500 Fryar Creek Dr
- 104 Castlebury Creek Ct
- 407 Fryar Creek Dr
- 404 Fryar Creek Dr
- 409 Fryar Creek Dr
- 109 Downing Forest Place
- 201 Downing Forest Place
- 405 Fryar Creek Dr
- 501 Fryar Creek Dr
- 105 Castlebury Creek Ct
- 106 Castlebury Creek Ct
- 502 Fryar Creek Dr
- 402 Fryar Creek Dr
- 203 Downing Forest Place
- 107 Downing Forest Place
- 403 Fryar Creek Dr
- 104 Spindle Creek Ct
- 503 Fryar Creek Dr