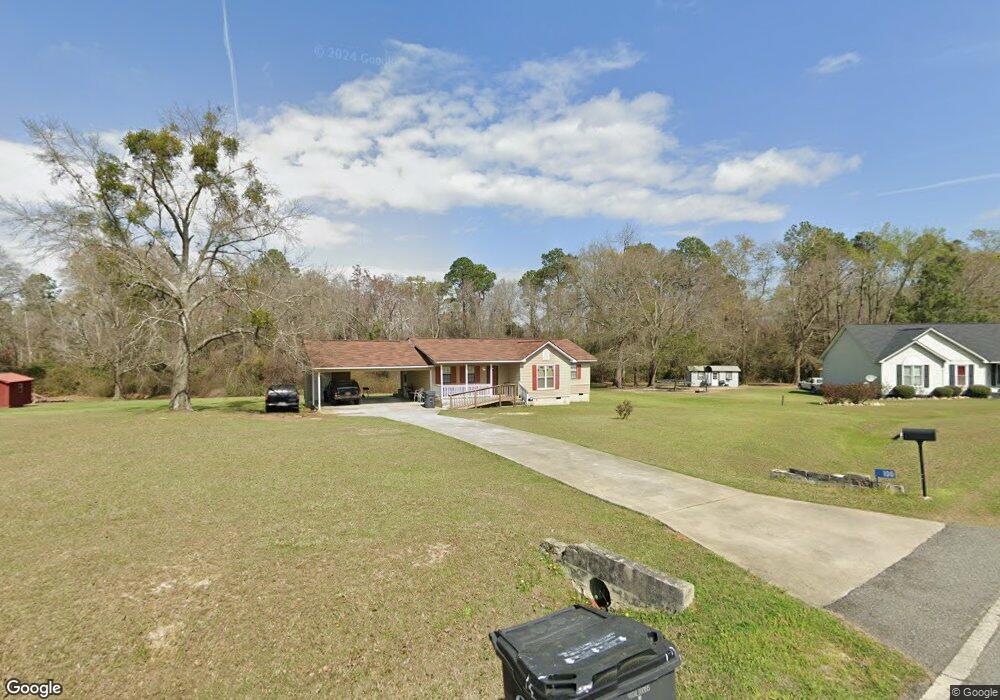
100 Rebecca Ct Cordele, GA 31015
Estimated Value: $123,000 - $161,000
3
Beds
2
Baths
1,140
Sq Ft
$123/Sq Ft
Est. Value
About This Home
This home is located at 100 Rebecca Ct, Cordele, GA 31015 and is currently estimated at $140,550, approximately $123 per square foot. 100 Rebecca Ct is a home located in Crisp County with nearby schools including Crisp County Elementary School, Crisp County Primary School, and Crisp County Middle School.
Ownership History
Date
Name
Owned For
Owner Type
Purchase Details
Closed on
May 26, 2005
Sold by
Rutherford Hoke
Bought by
Fullwood Ethel M
Current Estimated Value
Purchase Details
Closed on
Jul 14, 2004
Sold by
Kinnett Mary Ann
Bought by
Rutherford Hoke
Purchase Details
Closed on
Jun 14, 2004
Sold by
Usda Rural Development
Bought by
Kinnett Mary Ann
Purchase Details
Closed on
Jul 1, 2003
Sold by
Hayes Bambie N
Bought by
Usda Rural Development
Purchase Details
Closed on
Jun 30, 1998
Sold by
West John E and West Ellen
Bought by
Hayes Bambie N
Purchase Details
Closed on
Oct 1, 1996
Sold by
West John E and West Ellen
Bought by
West John E and West Ellen
Purchase Details
Closed on
Jun 13, 1995
Sold by
Cordele Banking Co
Bought by
West John E and West Ellen
Purchase Details
Closed on
Apr 10, 1992
Bought by
Cordele Banking Co
Create a Home Valuation Report for This Property
The Home Valuation Report is an in-depth analysis detailing your home's value as well as a comparison with similar homes in the area
Home Values in the Area
Average Home Value in this Area
Purchase History
| Date | Buyer | Sale Price | Title Company |
|---|---|---|---|
| Fullwood Ethel M | $69,000 | -- | |
| Rutherford Hoke | $45,000 | -- | |
| Kinnett Mary Ann | $42,000 | -- | |
| Usda Rural Development | -- | -- | |
| Hayes Bambie N | $70,000 | -- | |
| West John E | -- | -- | |
| West John E | -- | -- | |
| West John E | $52,000 | -- | |
| Cordele Banking Co | -- | -- |
Source: Public Records
Tax History Compared to Growth
Tax History
| Year | Tax Paid | Tax Assessment Tax Assessment Total Assessment is a certain percentage of the fair market value that is determined by local assessors to be the total taxable value of land and additions on the property. | Land | Improvement |
|---|---|---|---|---|
| 2025 | $534 | $36,829 | $2,000 | $34,829 |
| 2024 | $534 | $35,031 | $2,000 | $33,031 |
| 2023 | $528 | $34,239 | $2,000 | $32,239 |
| 2022 | $514 | $33,762 | $2,000 | $31,762 |
| 2021 | $504 | $31,969 | $2,000 | $29,969 |
| 2020 | $486 | $31,969 | $2,000 | $29,969 |
| 2019 | $481 | $31,969 | $2,000 | $29,969 |
| 2018 | $553 | $33,726 | $2,163 | $31,563 |
| 2017 | $1,037 | $33,726 | $2,163 | $31,563 |
| 2016 | $554 | $33,726 | $2,163 | $31,563 |
| 2015 | -- | $33,726 | $2,163 | $31,563 |
| 2014 | -- | $33,726 | $2,163 | $31,563 |
| 2013 | -- | $33,726 | $2,163 | $31,563 |
Source: Public Records
Map
Nearby Homes
- 1403 Georgia 90
- Lot #13 Lakeview Dr
- 1410 E 24th Ave
- 1509 E 20th Ave
- 1001 Stewart Ave
- TBD S Greer St
- 0 S Greer St
- 56 Aberdeen Cir
- 304 Timberland Dr
- 49 Aberdeen Cir
- 143 Edgewood Dr
- TBD Aberdeen Circle Lot#28
- 1022 E 29th Ave
- 1018 E 28th Ave
- 11 Lochridge Way
- 0 Pecan St S
- 1806 Georgia 90
- 3041 E Ga Hwy 280
- 68 Aberdeen Cir
- 104 Aberdeen Cir
- 102 Rebecca Ct
- 106 Jenny Lind Ln
- 101 Rebecca Ct
- 103 Rebecca Ct
- 104 Jenny Lind Ln
- 105 Rebecca Ct
- 106 Rebecca Ct
- 109 Halifax Way
- 111 Halifax Way
- 102 Jenny Lind Ln
- 107 Halifax Way
- 107 Rebecca Ct
- 108 Rebecca Ct
- 100 Jenny Lind Ln
- 110 Rebecca Ct
- 106 Halifax Way
- 109 Rebecca Ct
- 110 Halifax Way
- 108 Halifax Way
- 103 Halifax Way