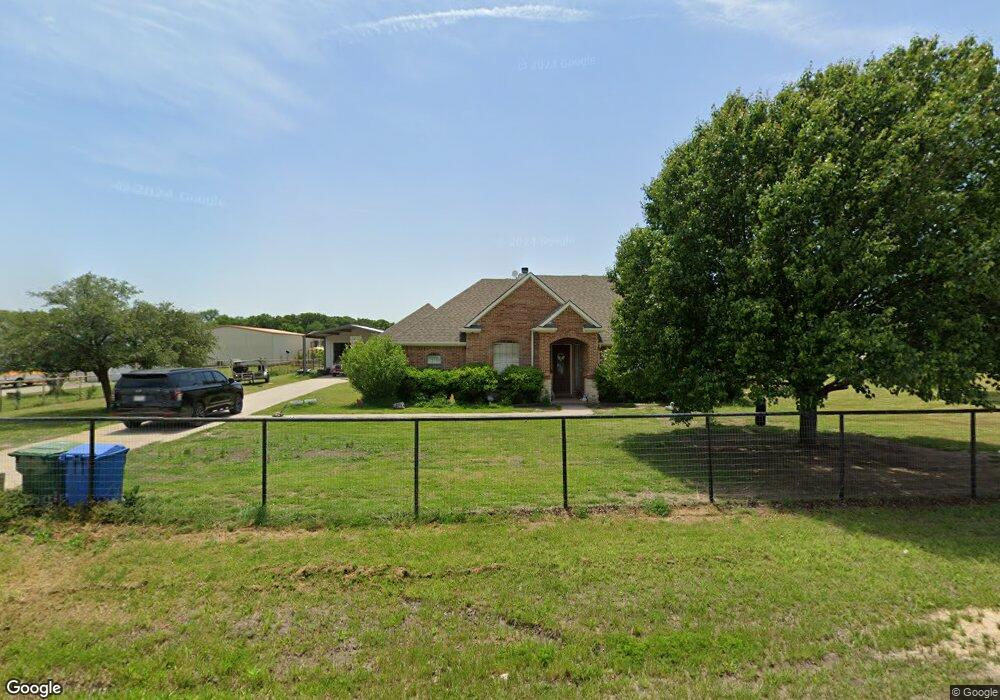
100 Tusk Ct Weatherford, TX 76085
Estimated Value: $518,474 - $580,000
4
Beds
3
Baths
2,421
Sq Ft
$229/Sq Ft
Est. Value
About This Home
This home is located at 100 Tusk Ct, Weatherford, TX 76085 and is currently estimated at $553,619, approximately $228 per square foot. 100 Tusk Ct is a home located in Parker County with nearby schools including Cross Timbers Elementary School, W E Hoover Elementary School, and Santo Forte Junior High School.
Ownership History
Date
Name
Owned For
Owner Type
Purchase Details
Closed on
Nov 17, 2020
Sold by
Parkinson Michael R
Bought by
Clark Rodney W
Current Estimated Value
Home Financials for this Owner
Home Financials are based on the most recent Mortgage that was taken out on this home.
Original Mortgage
$361,000
Outstanding Balance
$321,239
Interest Rate
2.8%
Mortgage Type
New Conventional
Estimated Equity
$232,380
Purchase Details
Closed on
Aug 25, 2015
Sold by
Mccollum Michael R and Mccollum Bonnie S
Bought by
Parkinson Michael R
Home Financials for this Owner
Home Financials are based on the most recent Mortgage that was taken out on this home.
Original Mortgage
$254,210
Interest Rate
4.37%
Mortgage Type
FHA
Purchase Details
Closed on
Jan 23, 2003
Sold by
Cozart Jeremy
Bought by
Parkinson Michael R
Purchase Details
Closed on
Apr 30, 2002
Sold by
Cozart Mark
Bought by
Parkinson Michael R
Purchase Details
Closed on
Nov 1, 2000
Sold by
Cozart Mark
Bought by
Parkinson Michael R
Create a Home Valuation Report for This Property
The Home Valuation Report is an in-depth analysis detailing your home's value as well as a comparison with similar homes in the area
Home Values in the Area
Average Home Value in this Area
Purchase History
| Date | Buyer | Sale Price | Title Company |
|---|---|---|---|
| Clark Rodney W | -- | Atd | |
| Parkinson Michael R | -- | Nat | |
| Parkinson Michael R | -- | -- | |
| Parkinson Michael R | -- | -- | |
| Parkinson Michael R | -- | -- |
Source: Public Records
Mortgage History
| Date | Status | Borrower | Loan Amount |
|---|---|---|---|
| Open | Clark Rodney W | $361,000 | |
| Previous Owner | Parkinson Michael R | $254,210 |
Source: Public Records
Tax History Compared to Growth
Tax History
| Year | Tax Paid | Tax Assessment Tax Assessment Total Assessment is a certain percentage of the fair market value that is determined by local assessors to be the total taxable value of land and additions on the property. | Land | Improvement |
|---|---|---|---|---|
| 2025 | $2,720 | $485,000 | $90,000 | $395,000 |
| 2024 | $2,720 | $457,480 | $80,000 | $377,480 |
| 2023 | $2,720 | $417,950 | $0 | $0 |
| 2022 | $7,031 | $379,960 | $40,990 | $338,970 |
| 2021 | $7,367 | $379,960 | $40,990 | $338,970 |
| 2020 | $5,448 | $295,890 | $32,890 | $263,000 |
| 2019 | $5,249 | $295,890 | $32,890 | $263,000 |
| 2018 | $4,787 | $257,570 | $17,500 | $240,070 |
| 2017 | $4,147 | $257,570 | $17,500 | $240,070 |
| 2016 | $3,770 | $192,970 | $17,500 | $175,470 |
| 2015 | $1,389 | $192,970 | $17,500 | $175,470 |
| 2014 | $3,526 | $190,420 | $17,500 | $172,920 |
Source: Public Records
Map
Nearby Homes
- 1033 Silver Sage Trail
- 1024 Silver Sage Trail
- 1113 Silver Sage Trail
- 1114 Silver Sage Trail
- 2000 Cypress Ct
- 1106 Silver Sage Trail
- 1046 Silver Sage Trail
- 2009 Cypress Ct
- 2004 Cypress Ct
- 1050 Silver Sage Trail
- 105 Ash Ln
- 687 Bent Tree Ln
- The Wilder Plan at Brooks Meadow
- The Ryder Plan at Brooks Meadow
- The Curran Plan at Brooks Meadow
- The Bennett Plan at Brooks Meadow
- The Jackson Plan at Brooks Meadow
- The Hunter Plan at Brooks Meadow
- The Aylin Plan at Brooks Meadow
- The Wellington II Plan at Brooks Meadow
- 21 Tusk Ct
- 1117 Finney Dr
- 104 Tusk Ct
- 103 Tusk Ct
- 101 Imperial Mammoth Valley Ln
- 1013 Finney Dr
- 1017 Finney Dr
- 105 Imperial Mammoth Valley Ln
- 1021 Finney Dr
- 27 Imperial Mammoth
- 21 Imperial Mammoth
- 37 Imperial Mammoth Ln
- 35 Imperial Mammoth Ln
- 33 Imperial Mammoth Ln
- 29 Imperial Mammoth Ln
- 19 Imperial Mammoth Ln
- 22 Imperial Mammoth Valley Ln
- 26 Imperial Mammoth
- 38 Imperial Mammoth Ln
- 36 Imperial Mammoth Ln