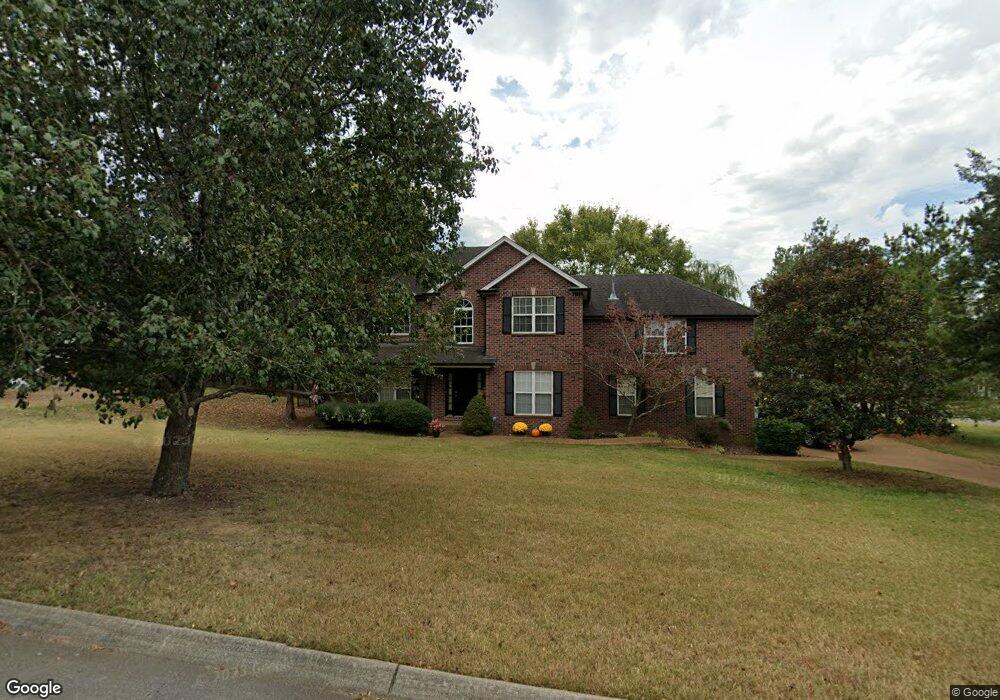
1000 Austin Ct Nolensville, TN 37135
Estimated Value: $648,000 - $779,000
--
Bed
3
Baths
2,494
Sq Ft
$280/Sq Ft
Est. Value
About This Home
This home is located at 1000 Austin Ct, Nolensville, TN 37135 and is currently estimated at $699,178, approximately $280 per square foot. 1000 Austin Ct is a home located in Williamson County with nearby schools including Nolensville Elementary School, Mill Creek Middle School, and Nolensville High School.
Ownership History
Date
Name
Owned For
Owner Type
Purchase Details
Closed on
Oct 28, 2005
Sold by
Moore Claudia A
Bought by
Hupka James and Hupka Catherine H
Current Estimated Value
Home Financials for this Owner
Home Financials are based on the most recent Mortgage that was taken out on this home.
Original Mortgage
$207,200
Outstanding Balance
$112,575
Interest Rate
6%
Mortgage Type
Fannie Mae Freddie Mac
Estimated Equity
$586,603
Purchase Details
Closed on
Oct 20, 2005
Sold by
Moore Mark W
Bought by
Moore Claudia A
Home Financials for this Owner
Home Financials are based on the most recent Mortgage that was taken out on this home.
Original Mortgage
$207,200
Outstanding Balance
$112,575
Interest Rate
6%
Mortgage Type
Fannie Mae Freddie Mac
Estimated Equity
$586,603
Purchase Details
Closed on
Apr 30, 1999
Sold by
Castle Builders Inc
Bought by
Moore Mark W and Moore Claudia A
Home Financials for this Owner
Home Financials are based on the most recent Mortgage that was taken out on this home.
Original Mortgage
$120,000
Interest Rate
7%
Create a Home Valuation Report for This Property
The Home Valuation Report is an in-depth analysis detailing your home's value as well as a comparison with similar homes in the area
Home Values in the Area
Average Home Value in this Area
Purchase History
| Date | Buyer | Sale Price | Title Company |
|---|---|---|---|
| Hupka James | $259,000 | Southern Land Title & Escrow | |
| Moore Claudia A | -- | Southern Land Title & Escrow | |
| Moore Mark W | $214,900 | -- |
Source: Public Records
Mortgage History
| Date | Status | Borrower | Loan Amount |
|---|---|---|---|
| Open | Hupka James | $207,200 | |
| Closed | Moore Claudia A | $51,800 | |
| Previous Owner | Moore Mark W | $120,000 |
Source: Public Records
Tax History Compared to Growth
Tax History
| Year | Tax Paid | Tax Assessment Tax Assessment Total Assessment is a certain percentage of the fair market value that is determined by local assessors to be the total taxable value of land and additions on the property. | Land | Improvement |
|---|---|---|---|---|
| 2025 | $2,319 | $166,500 | $47,500 | $119,000 |
| 2024 | $2,319 | $106,850 | $21,250 | $85,600 |
| 2023 | $2,319 | $106,850 | $21,250 | $85,600 |
| 2022 | $2,319 | $106,850 | $21,250 | $85,600 |
| 2021 | $2,319 | $106,850 | $21,250 | $85,600 |
| 2020 | $2,027 | $80,775 | $15,000 | $65,775 |
| 2019 | $1,878 | $79,225 | $15,000 | $64,225 |
| 2018 | $1,822 | $79,225 | $15,000 | $64,225 |
| 2017 | $1,807 | $79,225 | $15,000 | $64,225 |
| 2016 | $1,783 | $79,225 | $15,000 | $64,225 |
| 2015 | -- | $65,225 | $12,500 | $52,725 |
| 2014 | -- | $65,225 | $12,500 | $52,725 |
Source: Public Records
Map
Nearby Homes
- 720 Stonecastle Place
- 0 Nolensville Rd Unit RTC2807764
- 0 Nolensville Rd Unit RTC2818506
- 0 Bostic Unit RTC2516475
- 0 Nolensville Rd Unit RTC3017763
- 1115 Oak Creek Dr
- 2276 Rolling Hills Dr
- 829 Stonebrook Blvd
- 2248 Rolling Hills Dr
- 1016 Dortch Ln
- 813 Stonebrook Blvd
- 607 Quarter Horse Ln
- 4028 Rosa Dr
- 1228 Countryside Rd
- 3025 Ash Dale Ln
- 3051 Ash Dale Ln
- 3019 Ash Dale Ln
- 3027 Ash Dale Ln
- 136 Madison Mill Dr
- 625 Mer Rouge Dr