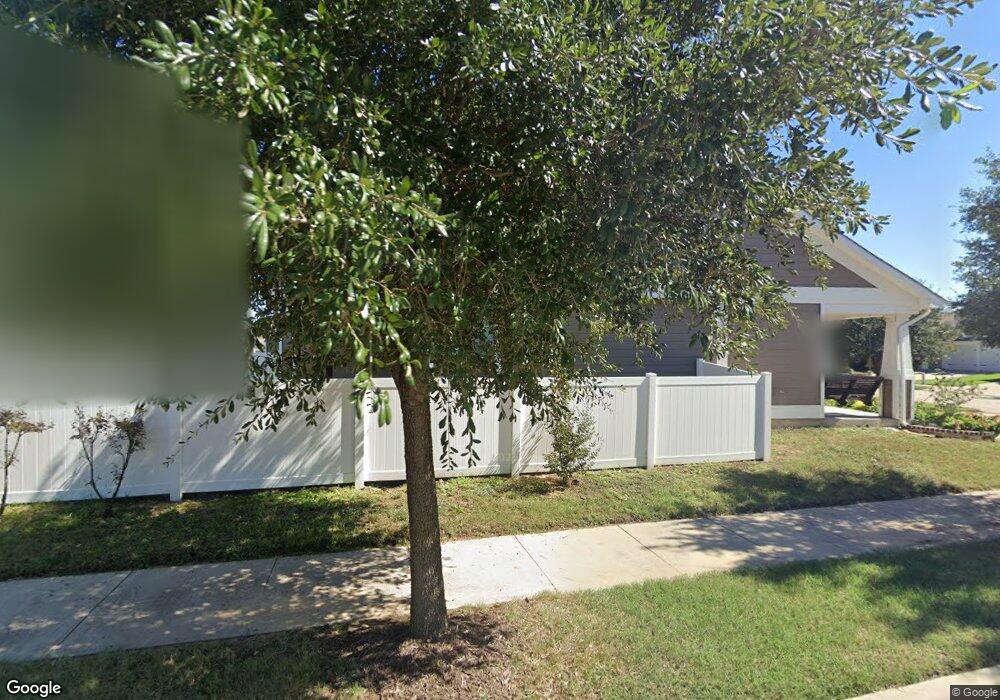
10003 Maple Dr Providence Village, TX 76227
Estimated Value: $327,000 - $344,000
4
Beds
3
Baths
2,607
Sq Ft
$128/Sq Ft
Est. Value
About This Home
This home is located at 10003 Maple Dr, Providence Village, TX 76227 and is currently estimated at $334,375, approximately $128 per square foot. 10003 Maple Dr is a home located in Denton County with nearby schools including Providence Elementary School, Rodriguez Middle School, and Ray E Braswell High School.
Ownership History
Date
Name
Owned For
Owner Type
Purchase Details
Closed on
Aug 17, 2018
Sold by
Griffin Robby J and Griffin Angela D
Bought by
Munoz Jesus G and Munoz Rosa L
Current Estimated Value
Home Financials for this Owner
Home Financials are based on the most recent Mortgage that was taken out on this home.
Original Mortgage
$203,920
Outstanding Balance
$174,071
Interest Rate
3.75%
Mortgage Type
Adjustable Rate Mortgage/ARM
Estimated Equity
$160,304
Purchase Details
Closed on
Apr 25, 2003
Sold by
Continental Homes Of Texas Lp
Bought by
Griffin Robby J and Griffin Angela D
Home Financials for this Owner
Home Financials are based on the most recent Mortgage that was taken out on this home.
Original Mortgage
$146,462
Interest Rate
8.5%
Create a Home Valuation Report for This Property
The Home Valuation Report is an in-depth analysis detailing your home's value as well as a comparison with similar homes in the area
Home Values in the Area
Average Home Value in this Area
Purchase History
| Date | Buyer | Sale Price | Title Company |
|---|---|---|---|
| Munoz Jesus G | -- | First American Title Insuran | |
| Griffin Robby J | -- | -- |
Source: Public Records
Mortgage History
| Date | Status | Borrower | Loan Amount |
|---|---|---|---|
| Open | Munoz Jesus G | $203,920 | |
| Previous Owner | Griffin Robby J | $146,462 |
Source: Public Records
Tax History Compared to Growth
Tax History
| Year | Tax Paid | Tax Assessment Tax Assessment Total Assessment is a certain percentage of the fair market value that is determined by local assessors to be the total taxable value of land and additions on the property. | Land | Improvement |
|---|---|---|---|---|
| 2025 | $5,311 | $350,000 | $98,880 | $251,120 |
| 2024 | $6,501 | $356,398 | $0 | $0 |
| 2023 | $4,841 | $323,998 | $98,880 | $302,451 |
| 2022 | $6,374 | $294,544 | $82,353 | $278,004 |
| 2021 | $6,439 | $267,767 | $60,941 | $206,826 |
| 2020 | $6,673 | $268,793 | $60,941 | $207,852 |
| 2019 | $6,845 | $266,818 | $60,941 | $205,877 |
| 2018 | $5,694 | $218,044 | $60,941 | $191,397 |
| 2017 | $5,245 | $198,222 | $60,941 | $173,477 |
| 2016 | $4,792 | $180,202 | $49,249 | $160,759 |
| 2015 | $3,957 | $163,820 | $32,063 | $142,893 |
| 2013 | -- | $135,388 | $32,063 | $103,325 |
Source: Public Records
Map
Nearby Homes
- 3521 Barnfield Ave
- 1031 Elm Dr
- 10117 Lakeview Dr
- 10013 Lakeview Dr
- 3552 Aster Ln
- 3524 Aster Ln
- 1220 Kingston Place
- 3540 Barnfield Ave
- 3564 Barnfield Ave
- 3521 Aster Ln
- 3537 Aster Ln
- 3529 Aster Ln
- 10061 Cedar Lake Dr
- 9821 Birch Dr
- 9870 Cedarcrest Dr
- 9908 Cedarcrest Dr
- 1925 Ventasso Blvd
- 1905 Ventasso Blvd
- 1857 Ventasso Blvd
- 1837 Ventasso Blvd
- 10005 Maple Dr
- 10007 Maple Dr
- 10006 Pinecrest Dr
- 1005 Live Oak Dr
- 1011 Live Oak Dr
- 1015 Live Oak Dr
- 10014 Pinecrest Dr
- 10009 Maple Dr
- 10002 Maple Dr
- 9920 Maple Dr
- 10006 Maple Dr
- 1021 Live Oak Dr
- 9918 Maple Dr
- 10018 Pinecrest Dr
- 10008 Maple Dr
- 10013 Maple Dr
- 1025 Live Oak Dr
- 9914 Maple Dr
- 10020 Pinecrest Dr
- 1010 Elm Dr