10006 Garden Hwy Yuba City, CA 95991
Estimated Value: $589,000 - $850,000
3
Beds
2
Baths
1,196
Sq Ft
$586/Sq Ft
Est. Value
About This Home
This home is located at 10006 Garden Hwy, Yuba City, CA 95991 and is currently estimated at $701,262, approximately $586 per square foot. 10006 Garden Hwy is a home with nearby schools including Central Gaither Elementary School, Yuba City High School, and Covenant Christian.
Ownership History
Date
Name
Owned For
Owner Type
Purchase Details
Closed on
Oct 23, 2013
Sold by
Campouris Steve
Bought by
Rmt Lp
Current Estimated Value
Home Financials for this Owner
Home Financials are based on the most recent Mortgage that was taken out on this home.
Original Mortgage
$253,500
Outstanding Balance
$190,190
Interest Rate
4.46%
Mortgage Type
Unknown
Estimated Equity
$511,072
Purchase Details
Closed on
May 8, 2003
Sold by
Singh Amar and Singh Chanan
Bought by
Campouris Steve
Home Financials for this Owner
Home Financials are based on the most recent Mortgage that was taken out on this home.
Original Mortgage
$100,000
Interest Rate
5.71%
Mortgage Type
Seller Take Back
Purchase Details
Closed on
Feb 7, 2003
Sold by
Punian Dhir Kaur and Punian Ajay Singh
Bought by
Singh Armar and Singh Chanan
Create a Home Valuation Report for This Property
The Home Valuation Report is an in-depth analysis detailing your home's value as well as a comparison with similar homes in the area
Home Values in the Area
Average Home Value in this Area
Purchase History
| Date | Buyer | Sale Price | Title Company |
|---|---|---|---|
| Rmt Lp | $390,000 | First American Title Company | |
| Campouris Steve | $175,000 | First American Title Co | |
| Campouris Steve | -- | First American Title Co | |
| Singh Armar | $84,000 | First American Title Co |
Source: Public Records
Mortgage History
| Date | Status | Borrower | Loan Amount |
|---|---|---|---|
| Open | Rmt Lp | $253,500 | |
| Previous Owner | Campouris Steve | $100,000 |
Source: Public Records
Tax History Compared to Growth
Tax History
| Year | Tax Paid | Tax Assessment Tax Assessment Total Assessment is a certain percentage of the fair market value that is determined by local assessors to be the total taxable value of land and additions on the property. | Land | Improvement |
|---|---|---|---|---|
| 2025 | $6,586 | $469,592 | $353,042 | $116,550 |
| 2024 | $6,586 | $460,386 | $346,120 | $114,266 |
| 2023 | $6,586 | $451,361 | $339,334 | $112,027 |
| 2022 | $6,372 | $442,512 | $332,681 | $109,831 |
| 2021 | $6,315 | $433,841 | $326,160 | $107,681 |
| 2020 | $6,226 | $429,393 | $322,816 | $106,577 |
| 2019 | $5,471 | $362,640 | $316,486 | $46,154 |
| 2018 | $5,410 | $355,529 | $310,280 | $45,249 |
| 2017 | $5,308 | $348,559 | $304,197 | $44,362 |
| 2016 | $5,228 | $341,725 | $298,233 | $43,492 |
| 2015 | $5,164 | $336,593 | $293,754 | $42,839 |
| 2014 | $5,121 | $330,000 | $288,000 | $42,000 |
Source: Public Records
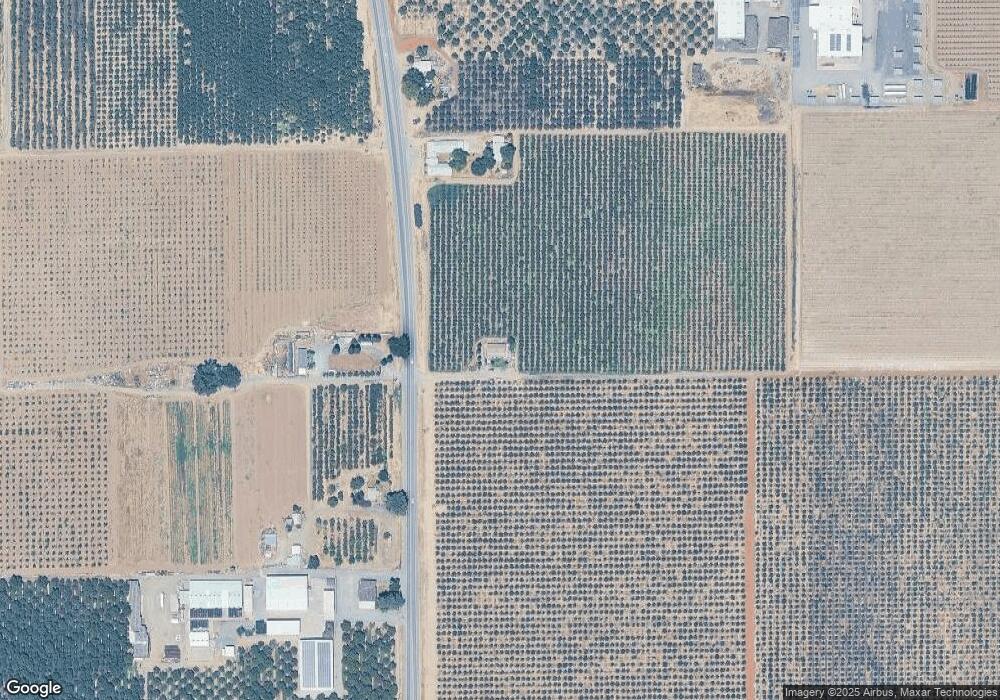
Map
Nearby Homes
- 332 Wilson Rd
- 11273 Garden Hwy
- 7327 Garden Hwy
- 1078 Camomile Dr
- 1757 Lockwood Dr
- 1440 Claridge Ct
- Plan 2622 Modeled at Cobblestone - Butte Vista
- Plan 2321 Modeled at Cobblestone - Butte Vista
- 1059 Aldersgate Dr
- 1095 Camomile Dr
- 1114 Camomile Dr
- 1471 Garnet Way
- 1107 Camomile Dr
- 1081 Aldersgate Dr
- 1417 Minories Dr
- 1789 Lockwood Dr
- 1529 Garnet Way
- 1119 Camomile Dr
- 1132 Camomile Dr
- 1746 Fleda Ave
- 10043 Garden Hwy
- 9886 Garden Hwy
- 10081 Garden Hwy
- 200 Wilkie Ave
- 9854 Garden Hwy
- 10261 Garden Hwy
- 241 Wilson Rd
- 368 Wilkie Ave
- 125 Wilkie Ave
- 9561 Garden Hwy
- 9542 Garden Hwy
- 111 Wilson Rd
- 9461 Garden Hwy
- 365 Wilson Rd
- 9248 Garden Hwy
- 10005 Garden Hwy
- 499 Wilson Rd
- 246 Oconnor Ave
- 9128 Garden Hwy
- 577 Wilson Rd