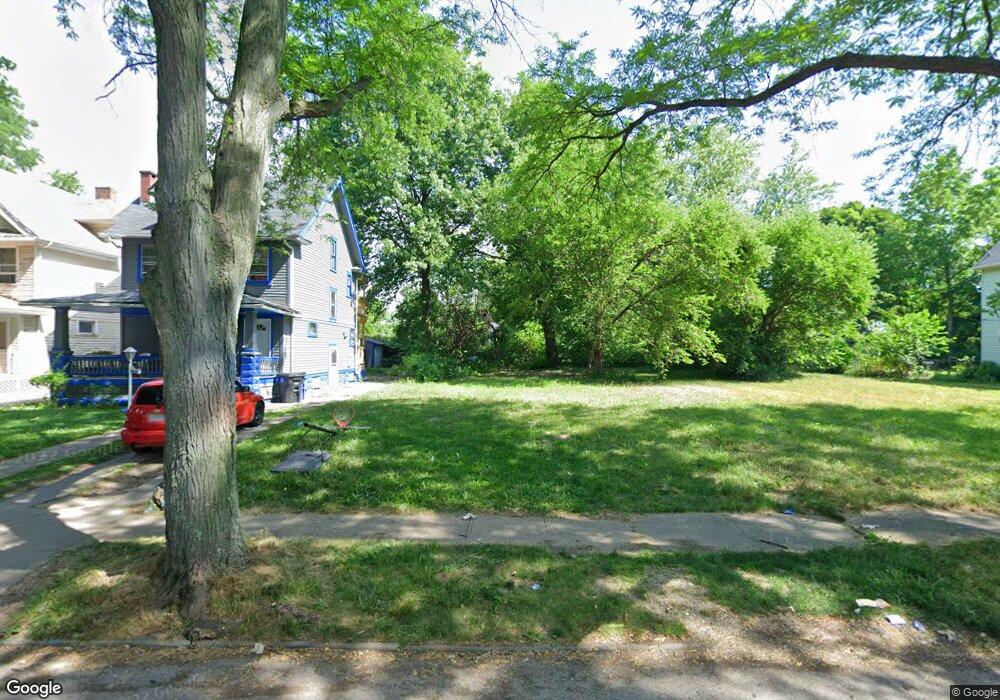
10009 Yale Ave Cleveland, OH 44108
Glenville NeighborhoodEstimated Value: $36,453
3
Beds
2
Baths
1,412
Sq Ft
$26/Sq Ft
Est. Value
About This Home
This home is located at 10009 Yale Ave, Cleveland, OH 44108 and is currently priced at $36,453, approximately $25 per square foot. 10009 Yale Ave is a home located in Cuyahoga County with nearby schools including Bolton, Anton Grdina School, and Andrew J. Rickoff School.
Ownership History
Date
Name
Owned For
Owner Type
Purchase Details
Closed on
Oct 18, 2023
Sold by
Cuyahoga County Land Reutilization Corpo
Bought by
City Of Cleveland
Current Estimated Value
Purchase Details
Closed on
Mar 19, 2012
Sold by
Richardson Erma J and Richardson Victor
Bought by
Albright Lari K
Purchase Details
Closed on
Jan 9, 2012
Sold by
Rivers Tyrone C and Stewart Rivers Gayetta
Bought by
Richardson Erma J
Purchase Details
Closed on
Dec 20, 2011
Sold by
Cartwright Verline
Bought by
Richardson Erma J
Purchase Details
Closed on
Jul 9, 2009
Sold by
Estate Of Nettie Mae Rivers
Bought by
Cartwright Verline and Brown Nadine
Purchase Details
Closed on
Nov 2, 2000
Sold by
Rivers Nettie M
Bought by
Cartwright Verline R
Purchase Details
Closed on
Aug 3, 1977
Sold by
Secy H U D
Bought by
Rivers Nettie M
Purchase Details
Closed on
Nov 5, 1976
Sold by
Eureka Federal
Bought by
Secy H U D
Purchase Details
Closed on
Jan 1, 1975
Bought by
Smart Edward and Smart Mattie
Create a Home Valuation Report for This Property
The Home Valuation Report is an in-depth analysis detailing your home's value as well as a comparison with similar homes in the area
Home Values in the Area
Average Home Value in this Area
Purchase History
| Date | Buyer | Sale Price | Title Company |
|---|---|---|---|
| City Of Cleveland | -- | None Listed On Document | |
| Albright Lari K | $6,200 | Ohio Real Title | |
| Richardson Erma J | -- | None Available | |
| Richardson Erma J | -- | None Available | |
| Richardson Erma J | -- | None Available | |
| Richardson Erma J | -- | None Available | |
| Cartwright Verline | -- | None Available | |
| Cartwright Verline R | -- | -- | |
| Rivers Nettie M | -- | -- | |
| Secy H U D | -- | -- | |
| Eureka Federal | $6,700 | -- | |
| Smart Edward | -- | -- |
Source: Public Records
Tax History Compared to Growth
Tax History
| Year | Tax Paid | Tax Assessment Tax Assessment Total Assessment is a certain percentage of the fair market value that is determined by local assessors to be the total taxable value of land and additions on the property. | Land | Improvement |
|---|---|---|---|---|
| 2024 | -- | $700 | $700 | -- |
| 2022 | $192 | $2,490 | $2,490 | $0 |
| 2021 | $190 | $2,490 | $2,490 | $0 |
| 2020 | $179 | $2,030 | $2,030 | $0 |
| 2019 | $14,632 | $6,800 | $5,800 | $1,000 |
| 2018 | $1,922 | $2,380 | $2,030 | $350 |
| 2017 | $937 | $7,880 | $1,120 | $6,760 |
| 2016 | $3,091 | $7,880 | $1,120 | $6,760 |
| 2015 | $1,609 | $7,880 | $1,120 | $6,760 |
| 2014 | $1,609 | $8,760 | $1,230 | $7,530 |
Source: Public Records
Map
Nearby Homes
- 10100 Yale Ave
- 9902 Garfield Ave
- 10003 Empire Ave
- 10009 Parmelee Ave
- 10413 Yale Ave
- 10328 Empire Ave
- 9800 Parmelee Ave
- 9901 Columbia Ave
- 9508 Empire Ave
- 9502 Empire Ave
- 769 E 103rd St
- 10321 Kempton Ave
- 9210 Yale Ave
- 10525 Gooding Ave
- 9406 Columbia Ave
- 10515 Greenlawn Ave
- 9222 Columbia Ave
- 9922 Adams Ave
- 9107 Empire Ave
- 10313 Pierpont Ave
- 10005 Yale Ave
- 10103 Yale Ave
- 10003 Yale Ave
- 10107 Yale Ave
- 10201 Yale Ave
- 10001 Yale Ave
- 10008 Garfield Ave
- 9903 Yale Ave
- 10012 Garfield Ave
- 10004 Garfield Ave
- 10100 Garfield Ave
- 10000 Garfield Ave
- 9901 Yale Ave
- 10209 Yale Ave
- 9908 Garfield Ave
- 10008 Yale Ave
- 10108 Yale Ave
- 10004 Yale Ave
- 9809 Yale Ave
- 10002 Yale Ave