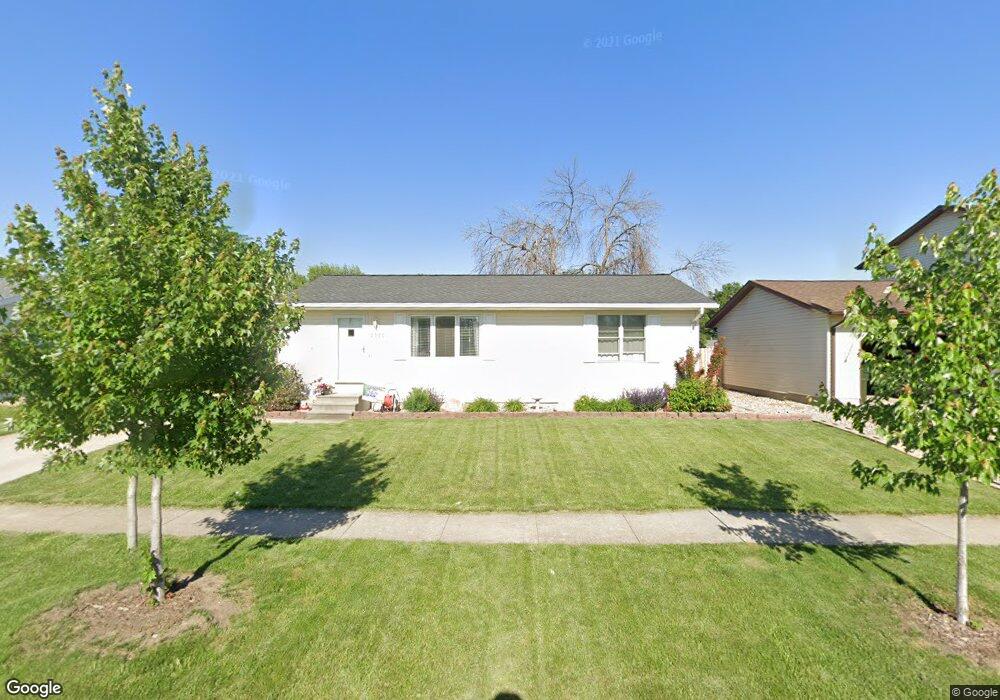
1001 Heartland Hills Dr Waterloo, IA 50701
Estimated Value: $209,000 - $242,000
3
Beds
1
Bath
960
Sq Ft
$230/Sq Ft
Est. Value
About This Home
This home is located at 1001 Heartland Hills Dr, Waterloo, IA 50701 and is currently estimated at $221,140, approximately $230 per square foot. 1001 Heartland Hills Dr is a home located in Black Hawk County with nearby schools including Orchard Hill Elementary School, Peet Junior High School, and Cedar Falls High School.
Ownership History
Date
Name
Owned For
Owner Type
Purchase Details
Closed on
Apr 4, 2008
Sold by
Clark Kristin M and Clark Jason
Bought by
Kartzell Nathanial R and Hartzell Theresa M
Current Estimated Value
Home Financials for this Owner
Home Financials are based on the most recent Mortgage that was taken out on this home.
Original Mortgage
$138,803
Outstanding Balance
$88,084
Interest Rate
6.09%
Mortgage Type
FHA
Estimated Equity
$133,056
Purchase Details
Closed on
Apr 25, 2005
Sold by
Rekow Andrew K W and Rekow Dena M
Bought by
Brunt Kristin M
Home Financials for this Owner
Home Financials are based on the most recent Mortgage that was taken out on this home.
Original Mortgage
$127,302
Interest Rate
6.06%
Mortgage Type
New Conventional
Create a Home Valuation Report for This Property
The Home Valuation Report is an in-depth analysis detailing your home's value as well as a comparison with similar homes in the area
Home Values in the Area
Average Home Value in this Area
Purchase History
| Date | Buyer | Sale Price | Title Company |
|---|---|---|---|
| Kartzell Nathanial R | $140,000 | None Available | |
| Brunt Kristin M | $130,000 | None Available |
Source: Public Records
Mortgage History
| Date | Status | Borrower | Loan Amount |
|---|---|---|---|
| Open | Kartzell Nathanial R | $138,803 | |
| Previous Owner | Brunt Kristin M | $127,302 |
Source: Public Records
Tax History Compared to Growth
Tax History
| Year | Tax Paid | Tax Assessment Tax Assessment Total Assessment is a certain percentage of the fair market value that is determined by local assessors to be the total taxable value of land and additions on the property. | Land | Improvement |
|---|---|---|---|---|
| 2025 | $3,582 | $199,550 | $29,930 | $169,620 |
| 2024 | $3,582 | $183,790 | $29,930 | $153,860 |
| 2023 | $3,194 | $183,790 | $29,930 | $153,860 |
| 2022 | $3,152 | $147,710 | $29,930 | $117,780 |
| 2021 | $2,818 | $147,710 | $29,930 | $117,780 |
| 2020 | $2,708 | $131,320 | $23,280 | $108,040 |
| 2019 | $2,708 | $131,320 | $23,280 | $108,040 |
| 2018 | $2,781 | $131,320 | $23,280 | $108,040 |
| 2017 | $2,690 | $131,320 | $23,280 | $108,040 |
| 2016 | $2,602 | $131,320 | $23,280 | $108,040 |
| 2015 | $2,602 | $131,320 | $23,280 | $108,040 |
| 2014 | $2,508 | $126,170 | $23,280 | $102,890 |
Source: Public Records
Map
Nearby Homes
- 1137 Fleur Dr
- Lot 19 Mark Dr
- Lot 22 Mark Dr
- Lot 20 Mark Dr
- Lot 15 Mark Dr
- Lot 21 Mark Dr
- Lot 16 Mark Dr
- Lot 23 Mark Dr
- 814 Heartland Hills Dr
- 3913 Onawa Dr
- 3917 Del Matro Rd
- 3824 Monterey Dr
- 3816 Monterey Dr
- Lot 26 Sager Ave
- Lot 27 Sager Ave
- Lot 2 Matthew Dr
- Lot 5 Matthew Luke Dr
- Lot 24 Mark Luke Ave
- Lot 14 Mark Luke Dr
- 102 Bergen Dr
- 1007 Heartland Hills Dr
- 929 Heartland Hills Dr
- 1015 Heartland Hills Dr
- 925 Heartland Hills Dr
- 1023 Heartland Hills Dr
- 1104 Fleur Dr
- 1122 Fleur Dr
- 920 Heartland Hills Dr
- 4009 Mark Dr
- 1018 Heartland Hills Dr
- 1110 Fleur Dr
- 1116 Fleur Dr
- 1052 Fleur Dr
- 1128 Fleur Dr
- 917 Heartland Hills Dr
- 1027 Heartland Hills Dr
- 4008 Mark Dr
- 4008 Jill Dr
- 4015 Mark Dr
- 1046 Fleur Dr