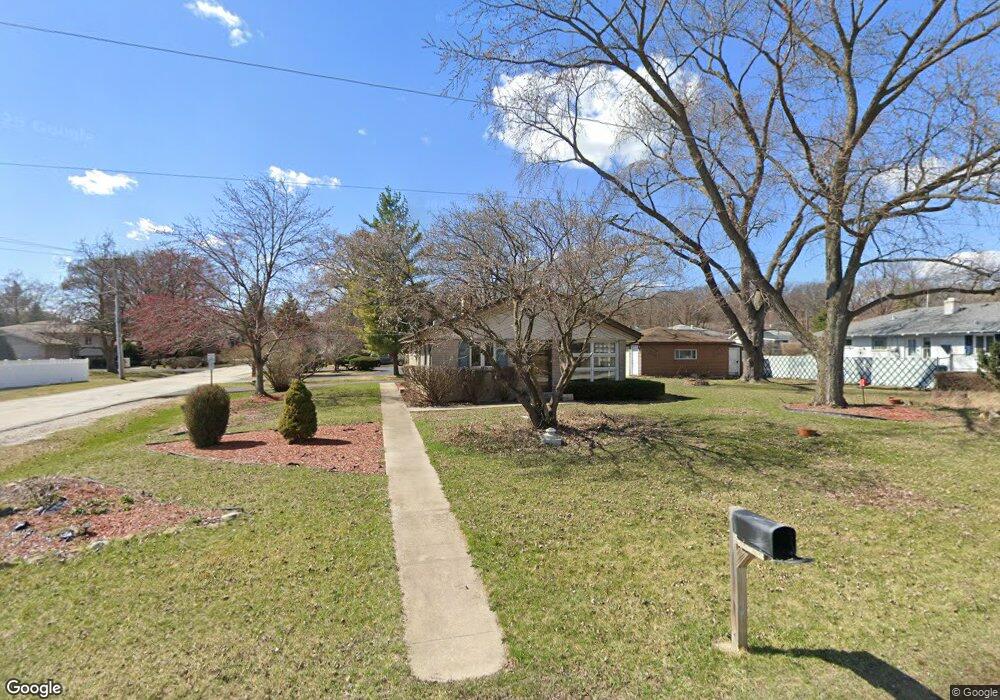
10010 S 82nd Ave Palos Hills, IL 60465
Estimated Value: $291,000 - $346,000
3
Beds
1
Bath
1,066
Sq Ft
$300/Sq Ft
Est. Value
About This Home
This home is located at 10010 S 82nd Ave, Palos Hills, IL 60465 and is currently estimated at $319,485, approximately $299 per square foot. 10010 S 82nd Ave is a home located in Cook County with nearby schools including Sorrick Elementary School, Oak Ridge Elementary School, and H H Conrady Jr High School.
Ownership History
Date
Name
Owned For
Owner Type
Purchase Details
Closed on
Jun 1, 2011
Sold by
Mccarthy James I
Bought by
Sollis Matthew
Current Estimated Value
Home Financials for this Owner
Home Financials are based on the most recent Mortgage that was taken out on this home.
Original Mortgage
$143,925
Outstanding Balance
$99,776
Interest Rate
4.75%
Mortgage Type
FHA
Estimated Equity
$219,709
Purchase Details
Closed on
Apr 17, 2006
Sold by
Mccarthy James I and Mccarthy Margaret R
Bought by
Mccarthy James I
Purchase Details
Closed on
Jan 4, 1994
Sold by
Mccarthy James I and Mccarthy Margaret R
Bought by
Mccarthy James I and Mccarthy Margaret R
Home Financials for this Owner
Home Financials are based on the most recent Mortgage that was taken out on this home.
Original Mortgage
$56,000
Interest Rate
7.35%
Create a Home Valuation Report for This Property
The Home Valuation Report is an in-depth analysis detailing your home's value as well as a comparison with similar homes in the area
Home Values in the Area
Average Home Value in this Area
Purchase History
| Date | Buyer | Sale Price | Title Company |
|---|---|---|---|
| Sollis Matthew | $150,000 | None Available | |
| Mccarthy James I | -- | None Available | |
| Mccarthy James I | -- | -- |
Source: Public Records
Mortgage History
| Date | Status | Borrower | Loan Amount |
|---|---|---|---|
| Open | Sollis Matthew | $143,925 | |
| Previous Owner | Mccarthy James I | $56,000 |
Source: Public Records
Tax History Compared to Growth
Tax History
| Year | Tax Paid | Tax Assessment Tax Assessment Total Assessment is a certain percentage of the fair market value that is determined by local assessors to be the total taxable value of land and additions on the property. | Land | Improvement |
|---|---|---|---|---|
| 2024 | $4,938 | $19,156 | $7,750 | $11,406 |
| 2023 | $5,475 | $20,404 | $7,750 | $12,654 |
| 2022 | $5,475 | $18,424 | $6,750 | $11,674 |
| 2021 | $5,337 | $18,423 | $6,750 | $11,673 |
| 2020 | $5,816 | $19,905 | $6,750 | $13,155 |
| 2019 | $3,916 | $14,789 | $6,250 | $8,539 |
| 2018 | $4,541 | $17,117 | $6,250 | $10,867 |
| 2017 | $4,399 | $17,117 | $6,250 | $10,867 |
| 2016 | $3,726 | $13,282 | $5,500 | $7,782 |
| 2015 | $3,630 | $13,282 | $5,500 | $7,782 |
| 2014 | $3,883 | $14,178 | $5,500 | $8,678 |
| 2013 | $4,397 | $14,028 | $5,500 | $8,528 |
Source: Public Records
Map
Nearby Homes
- 9940 S Wood Ln
- 8360 W 100th Place
- 10125 S 81st Ct
- 10221 S Eleanor Ave
- 10226 S 81st Ave
- 9950 S 84th Terrace Unit 215
- 9954 S 84th Terrace Unit 109
- 10230 S 83rd Ct
- 10324 S 81st Ave
- 9719 S 81st Ave
- 7822 W 99th Place
- 7826 W 98th Place
- 7810 W 102nd St
- 10025 S 86th Ct
- 10408 S Alta Dr
- 10441 S 83rd Ave
- 10427 S Alta Dr
- 10409 Sheffield Dr Unit 13
- 9937 S 88th Ave
- 10531 S Roberts Rd Unit 2D
- 8220 W 100th Place
- 10020 S 82nd Ave
- 10002 S 82nd Ave
- 8158 W Erin Dr
- 8158 W Erin Dr
- 10040 S 82nd Ave
- 8223 W 100th Place
- 10021 S 82nd Ct
- 9942 S 82nd Ave
- 8150 W Erin Dr
- 8150 W Erin Dr
- 10015 S 82nd Ct
- 10064 S 82nd Ave
- 8144 W Erin Dr
- 8144 W Erin Dr
- 8157 W Erin Dr
- 8157 W Erin Dr
- 10007 S 82nd Ct
- 9938 S 82nd Ave
- 10016 S Eleanor Ave