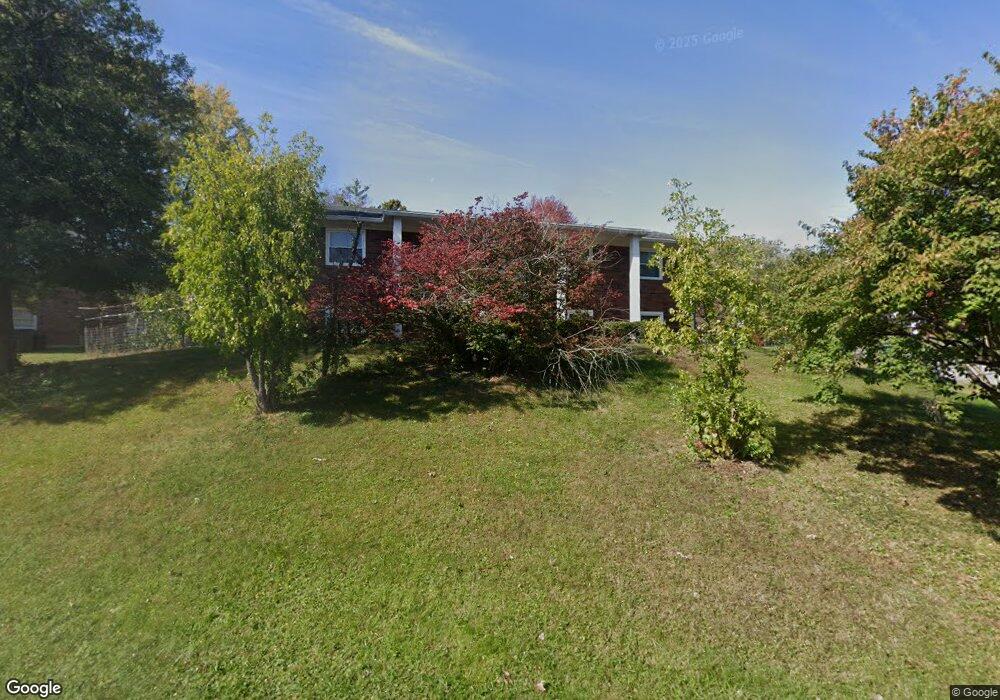
10017 Foxboro Dr Louisville, KY 40223
Estimated Value: $298,000 - $372,424
4
Beds
3
Baths
2,367
Sq Ft
$145/Sq Ft
Est. Value
About This Home
This home is located at 10017 Foxboro Dr, Louisville, KY 40223 and is currently estimated at $344,106, approximately $145 per square foot. 10017 Foxboro Dr is a home located in Jefferson County with nearby schools including Middletown Elementary School, Bowen Elementary School, and Hite Elementary School.
Ownership History
Date
Name
Owned For
Owner Type
Purchase Details
Closed on
Nov 15, 2021
Sold by
You Bryan S and Choi Young
Bought by
Choi Chun S and Choi Sook Jo
Current Estimated Value
Purchase Details
Closed on
May 28, 2015
Sold by
Choi Young G
Bought by
Brunton Sin Ae
Purchase Details
Closed on
Jul 18, 2013
Sold by
Brunton Sin Ae
Bought by
Choi Young G
Purchase Details
Closed on
Dec 21, 2005
Sold by
Choi Joeng Gyu and Choi Song Ja
Bought by
Choi Yong and Yoo Hyun S
Home Financials for this Owner
Home Financials are based on the most recent Mortgage that was taken out on this home.
Original Mortgage
$178,600
Interest Rate
8.35%
Mortgage Type
Fannie Mae Freddie Mac
Purchase Details
Closed on
May 25, 2001
Sold by
Flemons Lester L and Flemons Angela R
Bought by
Choi Joeng Gyu and Choi Song Ja
Create a Home Valuation Report for This Property
The Home Valuation Report is an in-depth analysis detailing your home's value as well as a comparison with similar homes in the area
Home Values in the Area
Average Home Value in this Area
Purchase History
| Date | Buyer | Sale Price | Title Company |
|---|---|---|---|
| Choi Chun S | $150,000 | Legacy Title Company | |
| Choi Chun S | $150,000 | Legacy Title | |
| Brunton Sin Ae | -- | Attorney | |
| Choi Young G | -- | None Available | |
| Choi Yong | $188,000 | None Available | |
| Choi Joeng Gyu | $132,000 | First Title |
Source: Public Records
Mortgage History
| Date | Status | Borrower | Loan Amount |
|---|---|---|---|
| Previous Owner | Choi Yong | $178,600 |
Source: Public Records
Tax History Compared to Growth
Tax History
| Year | Tax Paid | Tax Assessment Tax Assessment Total Assessment is a certain percentage of the fair market value that is determined by local assessors to be the total taxable value of land and additions on the property. | Land | Improvement |
|---|---|---|---|---|
| 2024 | $2,494 | $265,520 | $65,000 | $200,520 |
| 2023 | $3,075 | $265,520 | $65,000 | $200,520 |
| 2022 | $3,085 | $209,260 | $35,000 | $174,260 |
| 2021 | $2,626 | $209,260 | $35,000 | $174,260 |
| 2020 | $2,411 | $209,260 | $35,000 | $174,260 |
| 2019 | $2,362 | $209,260 | $35,000 | $174,260 |
| 2018 | $2,334 | $209,260 | $35,000 | $174,260 |
| 2017 | $2,196 | $209,260 | $35,000 | $174,260 |
| 2013 | $1,880 | $188,000 | $30,000 | $158,000 |
Source: Public Records
Map
Nearby Homes
- 701 Dorsey Way
- 714 Berwyn Dr
- 10025 Clearcreek Way
- 10407 Forest Garden Ln
- 902 Forest Bridge Rd
- 809 Foxfire Dr
- 1027 Garden Creek Cir
- 9608 Bay Hill Dr
- 10622 Riva Rd Unit 10622
- 10611 Riva Rd
- 9604 Tamarisk Pkwy
- 701 Forest Park Rd Unit 701
- 105 Dorsey Way
- 10745 Colonial Woods Ct
- 421 Creason Ct Unit 207
- 1119 La Fontenay Ct Unit 1119
- 1116 La Fontenay Ct Unit 1116
- 1102 La Fontenay Ct
- 410 Ethridge Ave Unit 207
- 812 La Fontenay Ct Unit 812
- 10015 Foxboro Dr
- 804 Skylark Dr
- 10013 Foxboro Dr
- 801 Skylark Dr
- 806 Skylark Dr
- 805 Foxwood Ave
- 10020 Foxboro Dr
- 10018 Foxboro Dr
- 803 Skylark Dr
- 807 Foxwood Ave
- 10016 Foxboro Dr
- 808 Skylark Dr
- 10014 Foxboro Dr
- 10012 Foxboro Dr
- 809 Foxwood Ave
- 10103 Foxboro Dr
- 10103 Kimblewick Dr
- 810 Skylark Dr
- 10010 Foxboro Dr
- 811 Foxwood Ave