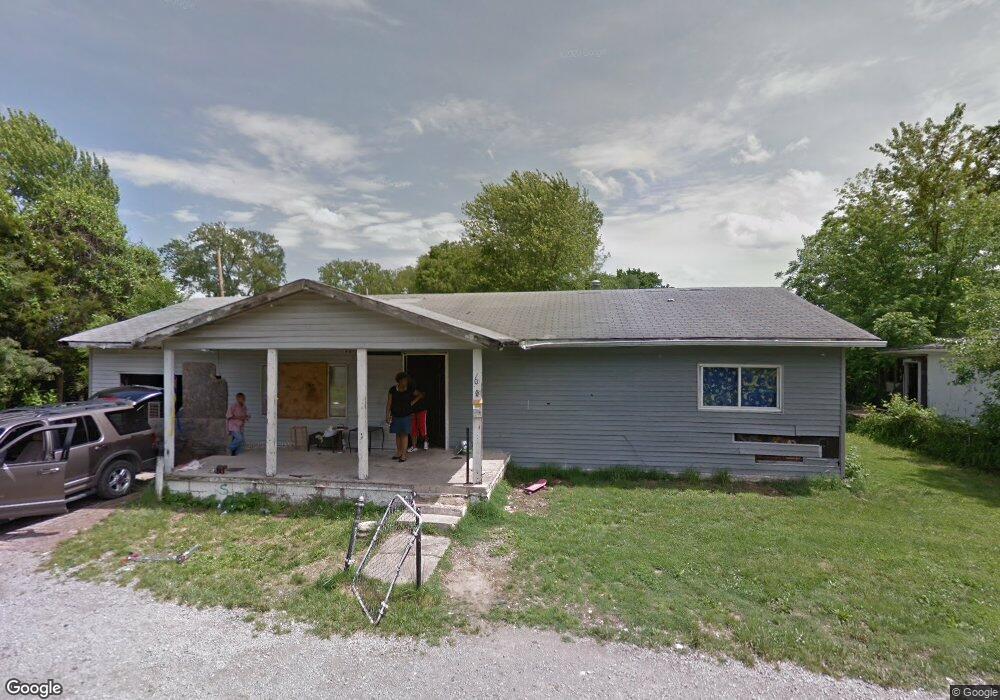
1002 S 55th St East Saint Louis, IL 62207
Estimated Value: $33,000 - $115,000
--
Bed
--
Bath
1,440
Sq Ft
$51/Sq Ft
Est. Value
About This Home
This home is located at 1002 S 55th St, East Saint Louis, IL 62207 and is currently estimated at $72,911, approximately $50 per square foot. 1002 S 55th St is a home located in St. Clair County.
Ownership History
Date
Name
Owned For
Owner Type
Purchase Details
Closed on
Nov 20, 2021
Sold by
St Clair County
Bought by
Mcclain Sherangelia and Gaston Quincy
Current Estimated Value
Purchase Details
Closed on
Jul 25, 2018
Sold by
Bynum Gennifer L
Bought by
Saint Clair County
Purchase Details
Closed on
Jan 27, 2012
Sold by
Mcclain Stanley Mollie
Bought by
Bynum Gennifer
Purchase Details
Closed on
Jan 11, 2010
Sold by
County Of Saint Clair
Bought by
Mcclain Stanley Mollie
Purchase Details
Closed on
Jul 1, 2009
Sold by
Winston James
Bought by
County Of St Clair
Create a Home Valuation Report for This Property
The Home Valuation Report is an in-depth analysis detailing your home's value as well as a comparison with similar homes in the area
Home Values in the Area
Average Home Value in this Area
Purchase History
| Date | Buyer | Sale Price | Title Company |
|---|---|---|---|
| Mcclain Sherangelia | -- | None Available | |
| Saint Clair County | -- | Attorney | |
| Bynum Gennifer | $5,000 | None Available | |
| Mcclain Stanley Mollie | -- | None Available | |
| County Of St Clair | -- | None Available |
Source: Public Records
Tax History Compared to Growth
Tax History
| Year | Tax Paid | Tax Assessment Tax Assessment Total Assessment is a certain percentage of the fair market value that is determined by local assessors to be the total taxable value of land and additions on the property. | Land | Improvement |
|---|---|---|---|---|
| 2024 | $869 | $797 | $797 | $0 |
| 2023 | $784 | $3,982 | $720 | $3,262 |
| 2022 | $715 | $3,490 | $631 | $2,859 |
| 2021 | $745 | $3,307 | $598 | $2,709 |
| 2020 | $0 | $104 | $52 | $52 |
| 2019 | $750 | $104 | $52 | $52 |
| 2018 | $786 | $106 | $53 | $53 |
| 2017 | $786 | $3,430 | $620 | $2,810 |
| 2016 | $823 | $3,417 | $618 | $2,799 |
| 2014 | $139 | $710 | $611 | $99 |
| 2013 | $469 | $666 | $573 | $93 |
Source: Public Records
Map
Nearby Homes