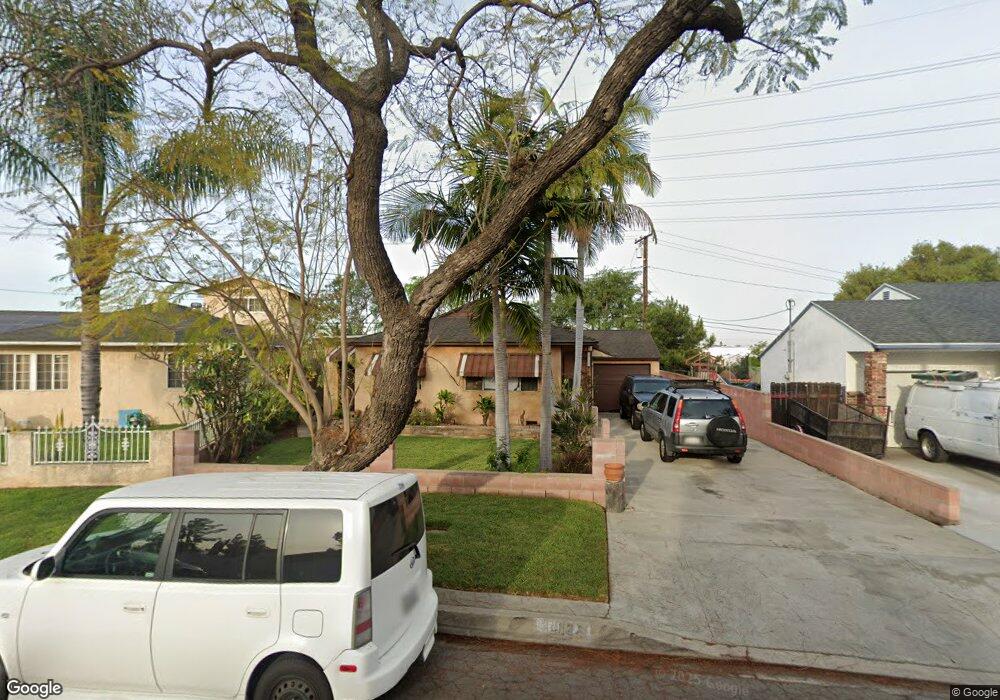
10024 Obregon St Whittier, CA 90606
Estimated Value: $704,000 - $808,646
3
Beds
2
Baths
1,397
Sq Ft
$551/Sq Ft
Est. Value
About This Home
This home is located at 10024 Obregon St, Whittier, CA 90606 and is currently estimated at $769,662, approximately $550 per square foot. 10024 Obregon St is a home located in Los Angeles County with nearby schools including Orange Grove Elementary School, Walter F. Dexter Middle School, and Whittier High School.
Ownership History
Date
Name
Owned For
Owner Type
Purchase Details
Closed on
Jun 12, 2008
Sold by
Marquez Raul
Bought by
Marquez Raul and Marquez Danny
Current Estimated Value
Purchase Details
Closed on
Mar 28, 2002
Sold by
Marquez Danny
Bought by
Hernandez Norma O
Home Financials for this Owner
Home Financials are based on the most recent Mortgage that was taken out on this home.
Original Mortgage
$129,311
Interest Rate
6.78%
Purchase Details
Closed on
Mar 4, 2002
Sold by
Hernandez Maria and Hernandez Norma O
Bought by
Marquez Raul and Marquez Maria
Home Financials for this Owner
Home Financials are based on the most recent Mortgage that was taken out on this home.
Original Mortgage
$129,311
Interest Rate
6.78%
Purchase Details
Closed on
May 17, 1996
Sold by
Hernandez Guillermo and Hernandez Maria
Bought by
Hernandez Guillermo and Hernandez Maria
Purchase Details
Closed on
Aug 28, 1993
Sold by
Hernandez Guillermo and Hernandez Maria
Bought by
Hernandez Guillermo and Hernandez Maria
Create a Home Valuation Report for This Property
The Home Valuation Report is an in-depth analysis detailing your home's value as well as a comparison with similar homes in the area
Home Values in the Area
Average Home Value in this Area
Purchase History
| Date | Buyer | Sale Price | Title Company |
|---|---|---|---|
| Marquez Raul | -- | Accommodation | |
| Hernandez Norma O | -- | Fidelity National Title Co | |
| Marquez Raul | $162,000 | Fidelity National Title Co | |
| Hernandez Guillermo | -- | -- | |
| Hernandez Guillermo | -- | -- |
Source: Public Records
Mortgage History
| Date | Status | Borrower | Loan Amount |
|---|---|---|---|
| Closed | Marquez Raul | $129,311 |
Source: Public Records
Tax History Compared to Growth
Tax History
| Year | Tax Paid | Tax Assessment Tax Assessment Total Assessment is a certain percentage of the fair market value that is determined by local assessors to be the total taxable value of land and additions on the property. | Land | Improvement |
|---|---|---|---|---|
| 2025 | $5,392 | $430,873 | $354,754 | $76,119 |
| 2024 | $5,392 | $422,426 | $347,799 | $74,627 |
| 2023 | $5,295 | $414,144 | $340,980 | $73,164 |
| 2022 | $5,189 | $406,025 | $334,295 | $71,730 |
| 2021 | $5,083 | $398,065 | $327,741 | $70,324 |
| 2019 | $4,996 | $386,260 | $318,021 | $68,239 |
| 2018 | $4,845 | $378,687 | $311,786 | $66,901 |
| 2016 | $4,653 | $363,984 | $299,680 | $64,304 |
| 2015 | $4,557 | $358,518 | $295,179 | $63,339 |
| 2014 | $4,492 | $351,496 | $289,397 | $62,099 |
Source: Public Records
Map
Nearby Homes
- 10013 Obregon St
- 10050 Obregon St
- 5729 Juarez Ave
- 5593 Pioneer Blvd Unit 18
- 5577 Pioneer Blvd Unit 5
- 5903 Redman Ave
- 9338 Via Azul
- 9332 Via Azul
- Plan 1560 at Azul
- Plan 1680 at Azul
- Plan 1706 Modeled at Azul
- 9328 Via Azul
- 9326 Via Azul
- 9324 Via Azul
- 9335 Via Azul
- 9339 Via Azul
- 9325 Via Azul
- 9900 Tagus St Unit 30
- 9409 Loch Avon Dr
- 5518 Norwalk Blvd
- 10026 Obregon St
- 10018 Obregon St
- 10032 Obregon St
- 10012 Obregon St
- 10036 Obregon St
- 10027 Obregon St
- 10008 Obregon St
- 10019 Obregon St
- 10042 Obregon St
- 10004 Obregon St
- 10007 Obregon St
- 10002 Obregon St
- 10001 Obregon St
- 10008 Eduardo Ave
- 10002 Eduardo Ave
- 10104 Obregon St
- 5702 Juarez Ave
- 5701 Juarez Ave
- 5701 Esperanza Ave
- 10051 Eduardo Ave