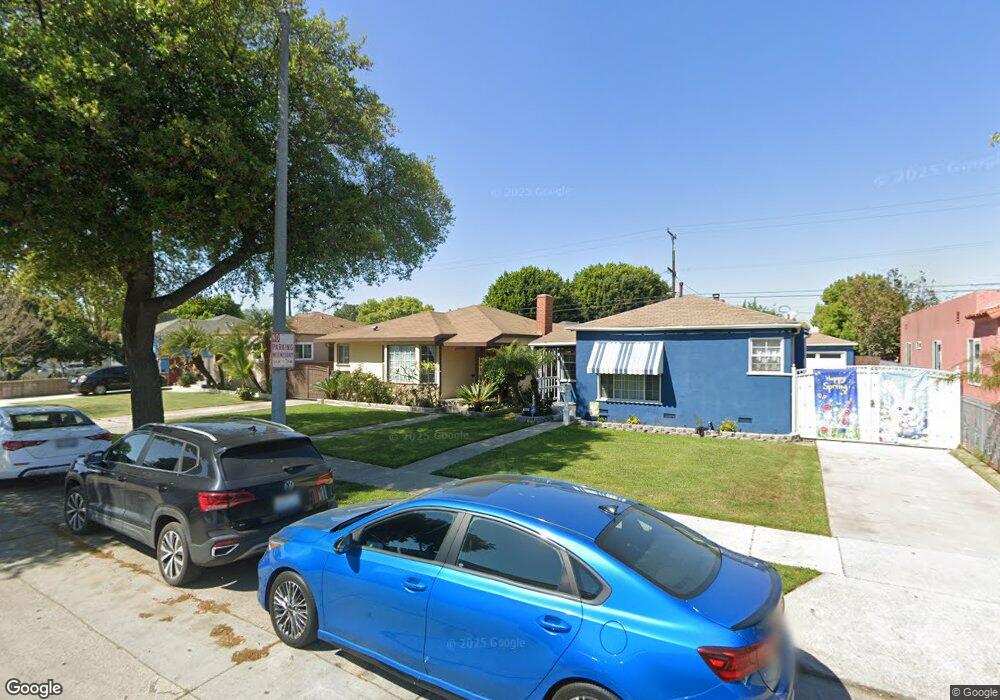
10029 Montara Ave South Gate, CA 90280
Estimated Value: $652,000 - $680,000
3
Beds
2
Baths
1,243
Sq Ft
$535/Sq Ft
Est. Value
About This Home
This home is located at 10029 Montara Ave, South Gate, CA 90280 and is currently estimated at $664,786, approximately $534 per square foot. 10029 Montara Ave is a home located in Los Angeles County with nearby schools including Montara Avenue Elementary School, Southeast Middle School, and South Gate Middle School.
Ownership History
Date
Name
Owned For
Owner Type
Purchase Details
Closed on
Mar 14, 2022
Sold by
Sanchez Jose Pina and Nunez Luz Elena
Bought by
Sanchez Jose Pina and Nunez Luz Elena
Current Estimated Value
Purchase Details
Closed on
Oct 19, 2005
Sold by
Sanchez Ricardo Pina
Bought by
Sanchez Jose Pina
Purchase Details
Closed on
Jun 11, 2001
Sold by
Sanchez Jose Pina and Sanchez Luz Elena
Bought by
Sanchez Jose Pina
Home Financials for this Owner
Home Financials are based on the most recent Mortgage that was taken out on this home.
Original Mortgage
$131,866
Interest Rate
7.14%
Mortgage Type
Purchase Money Mortgage
Purchase Details
Closed on
Jul 13, 1994
Sold by
Wilton Robert C
Bought by
Sanchez Jose Pina
Home Financials for this Owner
Home Financials are based on the most recent Mortgage that was taken out on this home.
Original Mortgage
$128,557
Interest Rate
4.25%
Create a Home Valuation Report for This Property
The Home Valuation Report is an in-depth analysis detailing your home's value as well as a comparison with similar homes in the area
Home Values in the Area
Average Home Value in this Area
Purchase History
| Date | Buyer | Sale Price | Title Company |
|---|---|---|---|
| Sanchez Jose Pina | -- | None Listed On Document | |
| Sanchez Jose Pina | -- | -- | |
| Sanchez Jose Pina | -- | American Title Co | |
| Sanchez Jose Pina | $143,000 | Orange Coast Title |
Source: Public Records
Mortgage History
| Date | Status | Borrower | Loan Amount |
|---|---|---|---|
| Previous Owner | Sanchez Jose Pina | $131,866 | |
| Previous Owner | Sanchez Jose Pina | $128,557 |
Source: Public Records
Tax History Compared to Growth
Tax History
| Year | Tax Paid | Tax Assessment Tax Assessment Total Assessment is a certain percentage of the fair market value that is determined by local assessors to be the total taxable value of land and additions on the property. | Land | Improvement |
|---|---|---|---|---|
| 2025 | $4,760 | $357,893 | $247,478 | $110,415 |
| 2024 | $4,760 | $350,876 | $242,626 | $108,250 |
| 2023 | $4,680 | $343,997 | $237,869 | $106,128 |
| 2022 | $4,459 | $337,253 | $233,205 | $104,048 |
| 2021 | $4,406 | $330,641 | $228,633 | $102,008 |
| 2019 | $4,268 | $320,836 | $221,852 | $98,984 |
| 2018 | $4,167 | $314,546 | $217,502 | $97,044 |
| 2016 | $3,981 | $302,334 | $209,057 | $93,277 |
| 2015 | $3,917 | $297,793 | $205,917 | $91,876 |
| 2014 | $3,918 | $291,961 | $201,884 | $90,077 |
Source: Public Records
Map
Nearby Homes
- 10031 San Anselmo Ave
- 2927 Missouri Ave
- 10303 Long Beach Blvd
- 9616 Long Beach Blvd
- 9612 Long Beach Blvd
- 10355 Long Beach Blvd
- 10430 San Jose Ave
- 2600 Nebraska Ave
- 10401 State St
- 3175 Ohio Ave
- 9320 Long Beach Blvd
- 9534 Deeble St
- 3358 Michigan Ave
- 3220 Tecumseh Ave
- 10245 Virginia Ave
- 2714 E 109th St
- 10249 California Ave
- 2500 Illinois Ave
- 10016 California Ave
- 2649 111th St
- 10021 Montara Ave
- 10037 Montara Ave
- 10019 Montara Ave
- 10043 Montara Ave
- 10030 San Anselmo Ave
- 10013 Montara Ave
- 10036 San Anselmo Ave
- 10024 San Anselmo Ave
- 10018 San Anselmo Ave
- 2941 Wisconsin Ave
- 10007 Montara Ave
- 10012 San Anselmo Ave
- 10105 Montara Ave
- 10006 San Anselmo Ave
- 10001 Montara Ave
- 10106 San Anselmo Ave
- 10115 Montara Ave
- 10000 San Anselmo Ave
- 9941 Montara Ave
- 3006 Wisconsin Ave