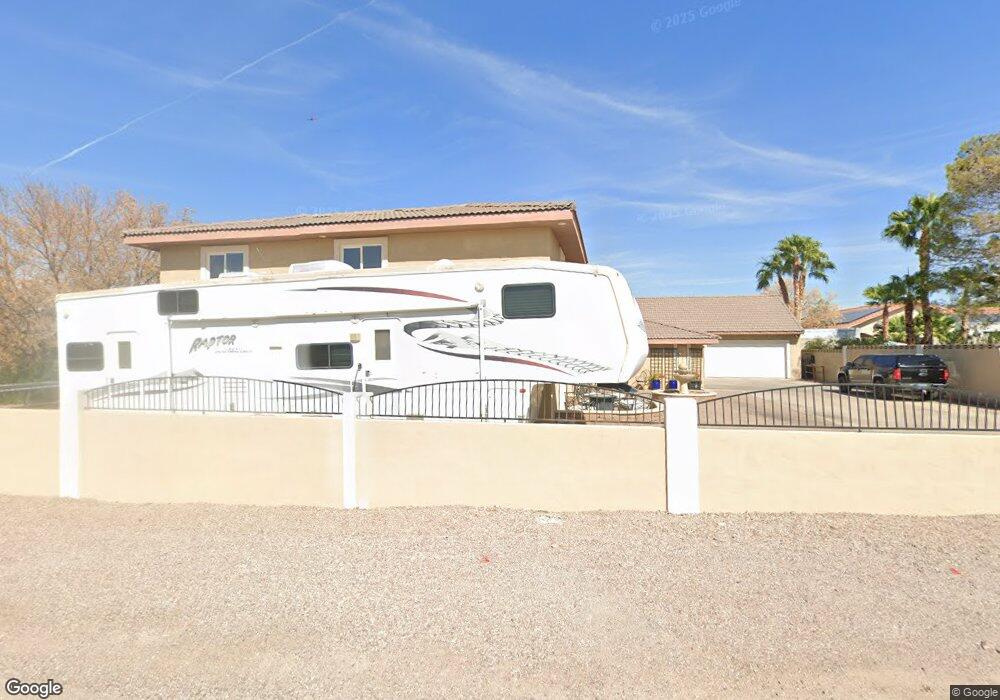
1004 Havre Ave Henderson, NV 89015
Foothills NeighborhoodEstimated Value: $637,000 - $952,000
4
Beds
4
Baths
3,332
Sq Ft
$247/Sq Ft
Est. Value
About This Home
This home is located at 1004 Havre Ave, Henderson, NV 89015 and is currently estimated at $822,512, approximately $246 per square foot. 1004 Havre Ave is a home located in Clark County with nearby schools including C T Sewell Elementary School, B Mahlon Brown Academy of International Studies, and Basic Academy of International Studies.
Ownership History
Date
Name
Owned For
Owner Type
Purchase Details
Closed on
Aug 27, 2025
Sold by
Mattoon Michael D and Mattoon Lisa
Bought by
Bowtie Brigade Trust
Current Estimated Value
Purchase Details
Closed on
Jul 30, 2001
Sold by
Swanson Bruce and Panet Swanson Monique
Bought by
Mattoon Michael D and Mattoon Lisa
Home Financials for this Owner
Home Financials are based on the most recent Mortgage that was taken out on this home.
Original Mortgage
$172,000
Interest Rate
7.09%
Purchase Details
Closed on
Feb 24, 1999
Sold by
Swanson Bruce L and Panet Raymond Monique
Bought by
Swanson Bruce and Panet Swanson Monique
Purchase Details
Closed on
Aug 3, 1995
Sold by
Richter Matthew P and Richter Dorothea C
Bought by
Swanson Bruce L and Panet Raymond Monique
Home Financials for this Owner
Home Financials are based on the most recent Mortgage that was taken out on this home.
Original Mortgage
$156,750
Interest Rate
7.59%
Create a Home Valuation Report for This Property
The Home Valuation Report is an in-depth analysis detailing your home's value as well as a comparison with similar homes in the area
Home Values in the Area
Average Home Value in this Area
Purchase History
| Date | Buyer | Sale Price | Title Company |
|---|---|---|---|
| Bowtie Brigade Trust | -- | None Listed On Document | |
| Mattoon Michael D | $215,000 | Old Republic Title Company | |
| Swanson Bruce | -- | -- | |
| Swanson Bruce L | $165,000 | Old Republic Title Company |
Source: Public Records
Mortgage History
| Date | Status | Borrower | Loan Amount |
|---|---|---|---|
| Previous Owner | Mattoon Michael D | $172,000 | |
| Previous Owner | Swanson Bruce L | $156,750 | |
| Closed | Mattoon Michael D | $32,200 |
Source: Public Records
Tax History Compared to Growth
Tax History
| Year | Tax Paid | Tax Assessment Tax Assessment Total Assessment is a certain percentage of the fair market value that is determined by local assessors to be the total taxable value of land and additions on the property. | Land | Improvement |
|---|---|---|---|---|
| 2025 | $3,166 | $181,662 | $52,500 | $129,162 |
| 2024 | $3,074 | $181,662 | $52,500 | $129,162 |
| 2023 | $3,074 | $174,623 | $52,500 | $122,123 |
| 2022 | $3,130 | $156,829 | $45,500 | $111,329 |
| 2021 | $2,898 | $148,147 | $42,000 | $106,147 |
| 2020 | $2,688 | $147,370 | $42,000 | $105,370 |
| 2019 | $2,519 | $135,204 | $31,500 | $103,704 |
| 2018 | $2,404 | $120,660 | $21,000 | $99,660 |
| 2017 | $3,549 | $122,430 | $21,000 | $101,430 |
| 2016 | $2,250 | $120,462 | $21,000 | $99,462 |
| 2015 | $2,246 | $103,885 | $14,000 | $89,885 |
| 2014 | $2,180 | $73,014 | $14,000 | $59,014 |
Source: Public Records
Map
Nearby Homes