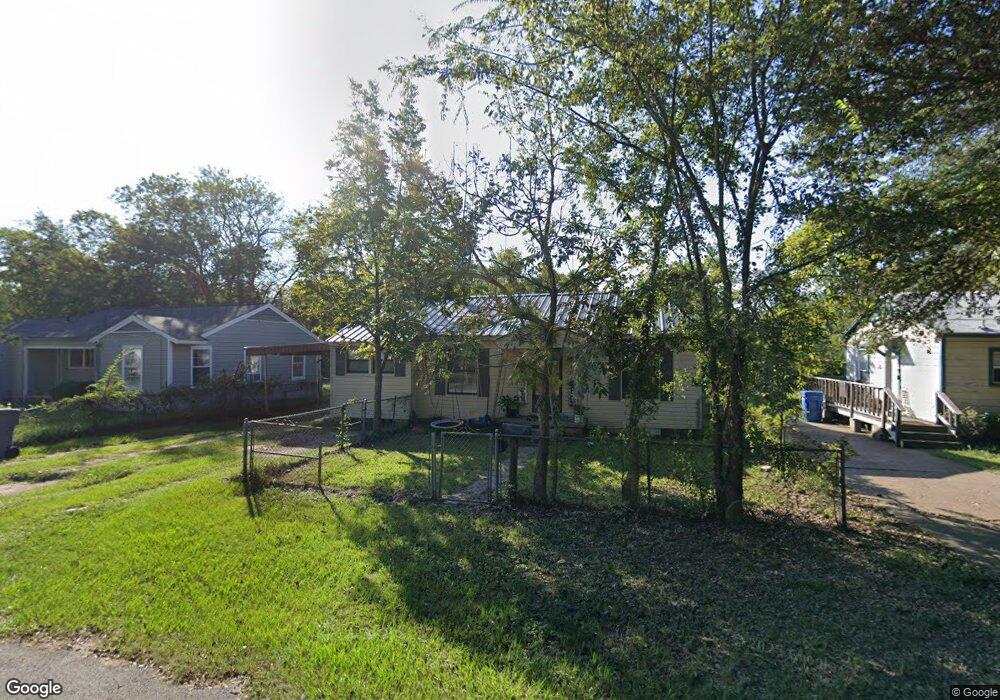
1004 Nesbitt Ave Lufkin, TX 75901
Estimated Value: $115,520 - $163,000
--
Bed
5
Baths
1,420
Sq Ft
$97/Sq Ft
Est. Value
About This Home
This home is located at 1004 Nesbitt Ave, Lufkin, TX 75901 and is currently estimated at $138,130, approximately $97 per square foot. 1004 Nesbitt Ave is a home located in Angelina County with nearby schools including Herty Primary School, Coston Elementary School, and Lufkin Middle School.
Ownership History
Date
Name
Owned For
Owner Type
Purchase Details
Closed on
Sep 10, 2020
Sold by
Sanchez Lorenzo and Sanchez Juanita
Bought by
Perez Jose A and Perez Yomaira
Current Estimated Value
Home Financials for this Owner
Home Financials are based on the most recent Mortgage that was taken out on this home.
Original Mortgage
$39,000
Outstanding Balance
$19,957
Interest Rate
2.8%
Mortgage Type
New Conventional
Estimated Equity
$118,173
Create a Home Valuation Report for This Property
The Home Valuation Report is an in-depth analysis detailing your home's value as well as a comparison with similar homes in the area
Home Values in the Area
Average Home Value in this Area
Purchase History
| Date | Buyer | Sale Price | Title Company |
|---|---|---|---|
| Perez Jose A | -- | None Available |
Source: Public Records
Mortgage History
| Date | Status | Borrower | Loan Amount |
|---|---|---|---|
| Open | Perez Jose A | $39,000 |
Source: Public Records
Tax History Compared to Growth
Tax History
| Year | Tax Paid | Tax Assessment Tax Assessment Total Assessment is a certain percentage of the fair market value that is determined by local assessors to be the total taxable value of land and additions on the property. | Land | Improvement |
|---|---|---|---|---|
| 2025 | $1,602 | $84,950 | $12,080 | $72,870 |
| 2024 | $1,456 | $82,950 | $12,080 | $70,870 |
| 2023 | $1,259 | $81,620 | $12,080 | $69,540 |
| 2022 | $1,312 | $57,590 | $4,290 | $53,300 |
| 2021 | $1,113 | $45,200 | $4,290 | $40,910 |
| 2020 | $1,006 | $40,950 | $4,290 | $36,660 |
| 2019 | $1,064 | $40,950 | $4,290 | $36,660 |
| 2018 | $603 | $39,610 | $4,290 | $35,320 |
| 2017 | $603 | $38,020 | $4,290 | $33,730 |
| 2016 | $944 | $39,590 | $4,540 | $35,050 |
| 2015 | -- | $46,520 | $4,540 | $41,980 |
| 2014 | -- | $44,990 | $4,540 | $40,450 |
Source: Public Records
Map
Nearby Homes