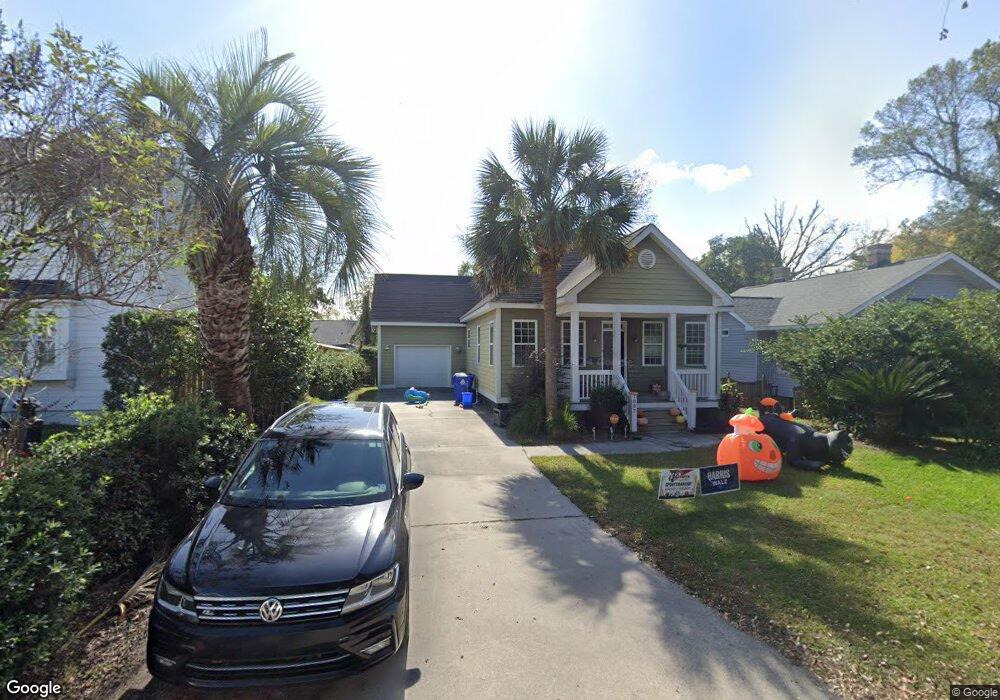
1007 Alamo St North Charleston, SC 29405
Park Circle NeighborhoodEstimated Value: $558,000 - $712,000
3
Beds
2
Baths
1,531
Sq Ft
$418/Sq Ft
Est. Value
About This Home
This home is located at 1007 Alamo St, North Charleston, SC 29405 and is currently estimated at $640,317, approximately $418 per square foot. 1007 Alamo St is a home located in Charleston County with nearby schools including North Charleston Elementary School, Morningside Middle, and North Charleston High.
Ownership History
Date
Name
Owned For
Owner Type
Purchase Details
Closed on
Nov 30, 2018
Sold by
Moody Marsha L
Bought by
Moody Marsha L and Thompson Carrie L
Current Estimated Value
Home Financials for this Owner
Home Financials are based on the most recent Mortgage that was taken out on this home.
Original Mortgage
$100,000
Outstanding Balance
$83,299
Interest Rate
4.8%
Mortgage Type
Credit Line Revolving
Estimated Equity
$557,018
Purchase Details
Closed on
Aug 27, 2010
Sold by
Plyler Emily A
Bought by
Moody Marsha L
Home Financials for this Owner
Home Financials are based on the most recent Mortgage that was taken out on this home.
Original Mortgage
$175,500
Outstanding Balance
$116,826
Interest Rate
4.6%
Mortgage Type
New Conventional
Estimated Equity
$523,491
Purchase Details
Closed on
Mar 24, 2010
Sold by
Plyler Samuel
Bought by
Plyler Emily
Purchase Details
Closed on
Apr 12, 2007
Sold by
Beasley Trading Co Llc
Bought by
Plyler Emily A and Plyler Samuel
Purchase Details
Closed on
May 1, 2006
Sold by
Hart W Dehler and Chisolm Walker J
Bought by
Beasley Trading Co Llc
Purchase Details
Closed on
Oct 15, 2004
Sold by
Schneider Wayne E and Schneider Herta M
Bought by
Peeples Nathan K
Create a Home Valuation Report for This Property
The Home Valuation Report is an in-depth analysis detailing your home's value as well as a comparison with similar homes in the area
Home Values in the Area
Average Home Value in this Area
Purchase History
| Date | Buyer | Sale Price | Title Company |
|---|---|---|---|
| Moody Marsha L | -- | None Available | |
| Moody Marsha L | $195,000 | -- | |
| Plyler Emily | -- | -- | |
| Plyler Emily A | $240,000 | None Available | |
| Beasley Trading Co Llc | $70,000 | None Available | |
| Peeples Nathan K | $149,000 | -- |
Source: Public Records
Mortgage History
| Date | Status | Borrower | Loan Amount |
|---|---|---|---|
| Open | Moody Marsha L | $100,000 | |
| Open | Moody Marsha L | $175,500 |
Source: Public Records
Tax History Compared to Growth
Tax History
| Year | Tax Paid | Tax Assessment Tax Assessment Total Assessment is a certain percentage of the fair market value that is determined by local assessors to be the total taxable value of land and additions on the property. | Land | Improvement |
|---|---|---|---|---|
| 2024 | $4,034 | $13,110 | $0 | $0 |
| 2023 | $4,034 | $13,110 | $0 | $0 |
| 2022 | $3,797 | $13,110 | $0 | $0 |
| 2021 | $3,767 | $13,110 | $0 | $0 |
| 2020 | $3,735 | $13,110 | $0 | $0 |
| 2019 | $3,388 | $11,400 | $0 | $0 |
| 2017 | $3,215 | $11,400 | $0 | $0 |
| 2016 | $3,119 | $11,400 | $0 | $0 |
| 2015 | $3,015 | $11,400 | $0 | $0 |
| 2014 | $2,825 | $0 | $0 | $0 |
| 2011 | -- | $0 | $0 | $0 |
Source: Public Records
Map
Nearby Homes
- 4626 O'Hear Ave
- 1086 Buist Ave
- 1057 Glenshaw St
- 4619 Jenkins Ave Unit 1-4
- 4444 Oakwood Ave
- 4457 Oakwood Ave
- 4436 Oakwood Ave
- 1086 Glenshaw St
- 4451 Oakwood Ave
- 4338 Oakwood Ave
- 4405 Oakwood Ave
- 4195 Saint Johns Ave
- 1008 Hunley Waters Cir
- 1174 Leesville St
- 4126 O'Hear Ave
- 4989 Chateau Ave
- 1181 Park Place S
- 4124 O'Hear Ave
- 4991 Chateau Ave
- 4350 Rugheimer Ave
- 1011 Alamo St
- 1005 Alamo St
- 1015 Alamo St
- 1001 Alamo St Unit A
- 1006 Buist Ave
- 1010 Buist Ave
- 1004 Buist Ave
- 1019 Alamo St
- 1014 Buist Ave
- 1006 Alamo St
- 1010 Alamo St
- 1004 Alamo St
- 1018 Buist Ave
- 1018 Alamo St
- 1022 Alamo St
- 4626 Ohear Ave
- 4620 Ohear Ave
- 4612 Ohear Ave
- 4612 Ohear Ave Unit 4
- 4612 Ohear Ave Unit 3