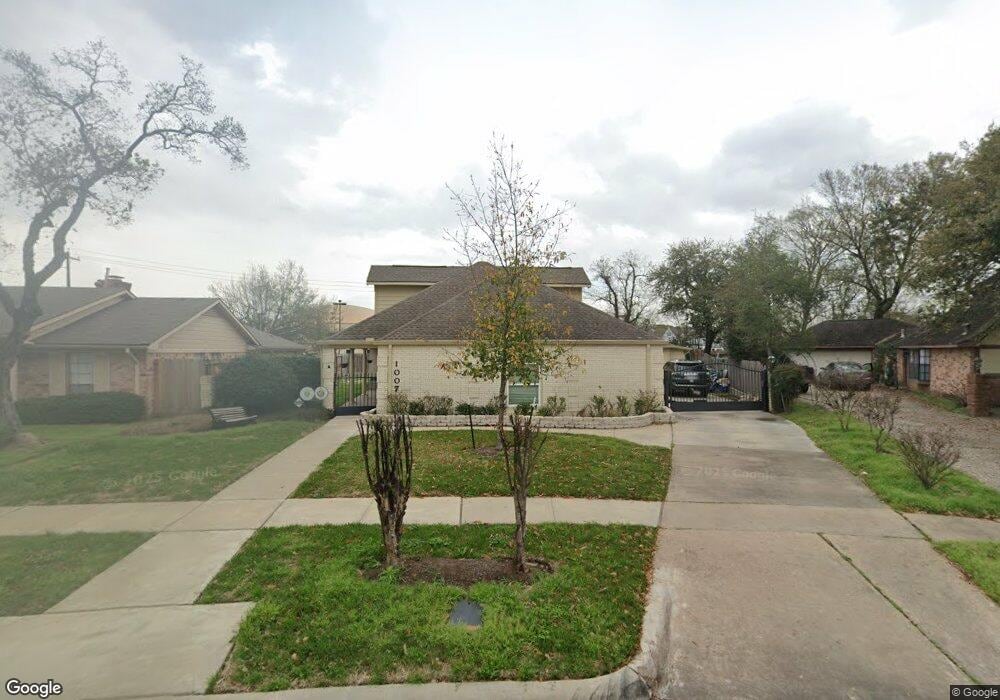
1007 Creekmont Dr Houston, TX 77091
Acres Homes NeighborhoodEstimated Value: $428,160 - $455,000
3
Beds
2
Baths
2,195
Sq Ft
$204/Sq Ft
Est. Value
About This Home
This home is located at 1007 Creekmont Dr, Houston, TX 77091 and is currently estimated at $447,040, approximately $203 per square foot. 1007 Creekmont Dr is a home located in Harris County with nearby schools including Highland Heights Elementary School, Williams Middle, and Booker T Washington Sr High.
Ownership History
Date
Name
Owned For
Owner Type
Purchase Details
Closed on
Aug 7, 2009
Sold by
Courville Carl
Bought by
Kimball Jason
Current Estimated Value
Home Financials for this Owner
Home Financials are based on the most recent Mortgage that was taken out on this home.
Original Mortgage
$171,338
Outstanding Balance
$113,017
Interest Rate
5.44%
Mortgage Type
FHA
Estimated Equity
$334,023
Purchase Details
Closed on
Mar 12, 2007
Sold by
Kandil Kaled
Bought by
Courville Carl
Home Financials for this Owner
Home Financials are based on the most recent Mortgage that was taken out on this home.
Original Mortgage
$144,000
Interest Rate
6.26%
Mortgage Type
Purchase Money Mortgage
Purchase Details
Closed on
Nov 22, 2000
Sold by
Wicks Henderson B and Wicks Fawillie P
Bought by
Kandil Kaled
Home Financials for this Owner
Home Financials are based on the most recent Mortgage that was taken out on this home.
Original Mortgage
$97,600
Interest Rate
7.82%
Create a Home Valuation Report for This Property
The Home Valuation Report is an in-depth analysis detailing your home's value as well as a comparison with similar homes in the area
Home Values in the Area
Average Home Value in this Area
Purchase History
| Date | Buyer | Sale Price | Title Company |
|---|---|---|---|
| Kimball Jason | -- | Multiple | |
| Courville Carl | -- | American Title Co | |
| Kandil Kaled | -- | American Title Co |
Source: Public Records
Mortgage History
| Date | Status | Borrower | Loan Amount |
|---|---|---|---|
| Open | Kimball Jason | $171,338 | |
| Previous Owner | Courville Carl | $144,000 | |
| Previous Owner | Kandil Kaled | $97,600 |
Source: Public Records
Tax History Compared to Growth
Tax History
| Year | Tax Paid | Tax Assessment Tax Assessment Total Assessment is a certain percentage of the fair market value that is determined by local assessors to be the total taxable value of land and additions on the property. | Land | Improvement |
|---|---|---|---|---|
| 2025 | $5,472 | $455,602 | $136,650 | $318,952 |
| 2024 | $5,472 | $455,602 | $136,650 | $318,952 |
| 2023 | $5,472 | $441,916 | $136,650 | $305,266 |
| 2022 | $6,881 | $428,247 | $136,650 | $291,597 |
| 2021 | $6,621 | $346,461 | $129,818 | $216,643 |
| 2020 | $6,254 | $365,043 | $129,818 | $235,225 |
| 2019 | $5,941 | $255,834 | $127,085 | $128,749 |
| 2018 | $4,041 | $213,446 | $91,100 | $122,346 |
| 2017 | $5,397 | $213,446 | $91,100 | $122,346 |
| 2016 | $5,397 | $213,446 | $91,100 | $122,346 |
| 2015 | $4,113 | $193,054 | $91,100 | $101,954 |
| 2014 | $4,113 | $160,000 | $45,550 | $114,450 |
Source: Public Records
Map
Nearby Homes
- 968 Ford Pines Ln
- 964 Ford Pines Ln
- 982 W Donovan St
- 949 Lilly Flower Ln
- 5123 Redemption Cir
- 1103 W Donovan St
- 5106 Prosperity Cir
- 950 Del Norte St
- 963 Marcella St
- 5121 E Lacey Garden Loop
- 1119 Cottage Oak Ln
- 1123 Cottage Oak Ln
- 5427 Alba Rd
- 1161 Eden Park Ln
- 927 S Lacey Garden Loop
- 5237 Brinkman St
- 1119 Marcella St
- 5227 Brinkman Ct
- 1118 Del Norte St
- 1151 Creekmont Dr
- 1003 Creekmont Dr
- 1011 Creekmont Dr
- 1002 Cottage Oak Ln
- 1015 Creekmont Dr
- 1019 Creekmont Dr
- 1006 Cottage Oak Ln
- 1019 Cottage Oak Ln Unit 770
- 1022 Creekmont Dr
- 1023 Creekmont Dr
- 1026 Creekmont Dr
- 1010 Cottage Oak Ln
- 1027 Creekmont Dr
- 1027 Cottage Oak Ln
- 1030 Creekmont Dr
- 1014 Cottage Oak Ln
- 1031 Creekmont Dr
- 1018 Cottage Oak Ln
- 1031 Cottage Oak Ln
- 1022 Cottage Oak Ln
- 1034 Creekmont Dr