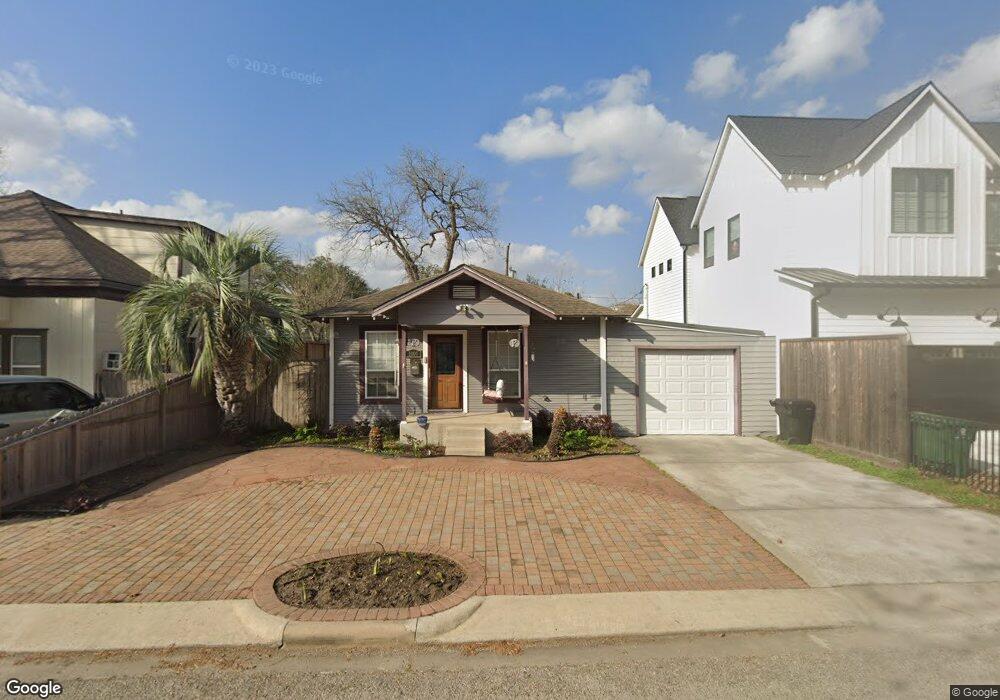
1009 Aurora St Houston, TX 77009
Greater Heights NeighborhoodEstimated Value: $469,000 - $617,000
2
Beds
1
Bath
1,326
Sq Ft
$396/Sq Ft
Est. Value
About This Home
This home is located at 1009 Aurora St, Houston, TX 77009 and is currently estimated at $525,242, approximately $396 per square foot. 1009 Aurora St is a home located in Harris County with nearby schools including Field Elementary School, Hamilton Middle, and Heights High School.
Ownership History
Date
Name
Owned For
Owner Type
Purchase Details
Closed on
Mar 3, 1999
Sold by
Wilson Allen W and Wilson Sandra L
Bought by
Fulks Ii Richard D and Fulks Melissa D
Current Estimated Value
Home Financials for this Owner
Home Financials are based on the most recent Mortgage that was taken out on this home.
Original Mortgage
$52,440
Interest Rate
6.73%
Create a Home Valuation Report for This Property
The Home Valuation Report is an in-depth analysis detailing your home's value as well as a comparison with similar homes in the area
Home Values in the Area
Average Home Value in this Area
Purchase History
| Date | Buyer | Sale Price | Title Company |
|---|---|---|---|
| Fulks Ii Richard D | -- | American Title Co | |
| Wilson Allen W | -- | American Title |
Source: Public Records
Mortgage History
| Date | Status | Borrower | Loan Amount |
|---|---|---|---|
| Closed | Fulks Ii Richard D | $52,440 |
Source: Public Records
Tax History Compared to Growth
Tax History
| Year | Tax Paid | Tax Assessment Tax Assessment Total Assessment is a certain percentage of the fair market value that is determined by local assessors to be the total taxable value of land and additions on the property. | Land | Improvement |
|---|---|---|---|---|
| 2025 | $5,827 | $466,161 | $450,000 | $16,161 |
| 2024 | $5,827 | $435,512 | $420,000 | $15,512 |
| 2023 | $5,827 | $467,104 | $420,000 | $47,104 |
| 2022 | $7,266 | $373,494 | $360,000 | $13,494 |
| 2021 | $6,992 | $300,000 | $288,000 | $12,000 |
| 2020 | $7,531 | $311,000 | $288,000 | $23,000 |
| 2019 | $7,598 | $307,000 | $288,000 | $19,000 |
| 2018 | $5,252 | $289,000 | $270,000 | $19,000 |
| 2017 | $6,275 | $289,000 | $270,000 | $19,000 |
| 2016 | $5,705 | $288,000 | $240,000 | $48,000 |
| 2015 | $3,675 | $300,000 | $240,000 | $60,000 |
| 2014 | $3,675 | $224,000 | $180,000 | $44,000 |
Source: Public Records
Map
Nearby Homes