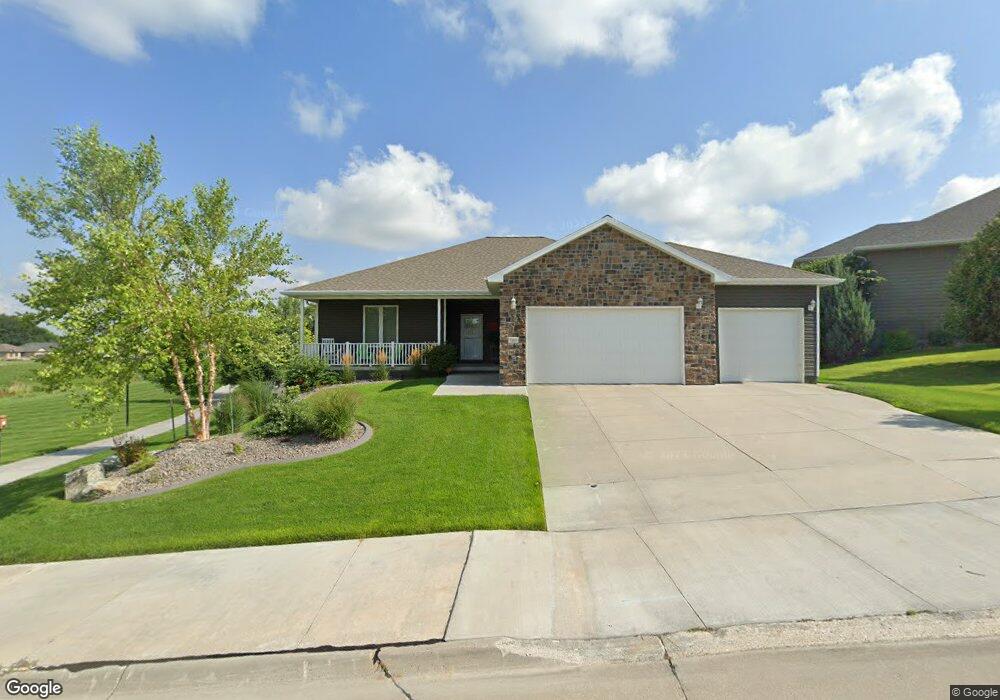
1009 W 45th St Kearney, NE 68845
Estimated Value: $488,000 - $512,919
3
Beds
4
Baths
1,812
Sq Ft
$277/Sq Ft
Est. Value
About This Home
This home is located at 1009 W 45th St, Kearney, NE 68845 and is currently estimated at $501,480, approximately $276 per square foot. 1009 W 45th St is a home with nearby schools including Buffalo Hills Elementary School, Sunrise Middle School, and Kearney Senior High School.
Ownership History
Date
Name
Owned For
Owner Type
Purchase Details
Closed on
Aug 3, 2018
Sold by
Diloreto Paul E and Diloreto Lindsey
Bought by
Stout Peter M and Stout Elizabeth A
Current Estimated Value
Home Financials for this Owner
Home Financials are based on the most recent Mortgage that was taken out on this home.
Original Mortgage
$150,000
Interest Rate
4.9%
Mortgage Type
New Conventional
Purchase Details
Closed on
Oct 11, 2016
Sold by
Campbell Patrick A and Campbell Emily K
Bought by
Diloreto Paul E and Diloreto Lindsey
Home Financials for this Owner
Home Financials are based on the most recent Mortgage that was taken out on this home.
Original Mortgage
$262,400
Interest Rate
3.5%
Mortgage Type
New Conventional
Purchase Details
Closed on
Aug 14, 2014
Sold by
Cory Development Inc
Bought by
Campbell Patrick A and Campbell Emily K
Purchase Details
Closed on
Jun 24, 2006
Sold by
Norsworthy Bernard A and Norsworthy Alyce D
Bought by
Grand West Llc
Create a Home Valuation Report for This Property
The Home Valuation Report is an in-depth analysis detailing your home's value as well as a comparison with similar homes in the area
Home Values in the Area
Average Home Value in this Area
Purchase History
| Date | Buyer | Sale Price | Title Company |
|---|---|---|---|
| Stout Peter M | $333,000 | Stewart Title | |
| Diloreto Paul E | $328,000 | Attorney | |
| Campbell Patrick A | $314,000 | Vintage Title | |
| Grand West Llc | $3,600 | None Listed On Document |
Source: Public Records
Mortgage History
| Date | Status | Borrower | Loan Amount |
|---|---|---|---|
| Previous Owner | Stout Peter M | $150,000 | |
| Previous Owner | Diloreto Paul E | $262,400 |
Source: Public Records
Tax History Compared to Growth
Tax History
| Year | Tax Paid | Tax Assessment Tax Assessment Total Assessment is a certain percentage of the fair market value that is determined by local assessors to be the total taxable value of land and additions on the property. | Land | Improvement |
|---|---|---|---|---|
| 2025 | $5,941 | $464,860 | $57,015 | $407,845 |
| 2024 | $5,941 | $446,385 | $55,355 | $391,030 |
| 2023 | $6,958 | $408,855 | $55,355 | $353,500 |
| 2022 | $6,015 | $342,785 | $55,050 | $287,735 |
| 2021 | $5,619 | $325,820 | $53,325 | $272,495 |
| 2020 | $5,367 | $310,295 | $53,325 | $256,970 |
| 2019 | $5,334 | $304,670 | $53,325 | $251,345 |
| 2018 | $5,273 | $305,475 | $52,730 | $252,745 |
| 2017 | $5,046 | $294,310 | $47,230 | $247,080 |
| 2016 | $5,038 | $296,270 | $47,230 | $249,040 |
| 2015 | $4,882 | $280,665 | $0 | $0 |
| 2014 | $3,118 | $163,565 | $0 | $0 |
Source: Public Records
Map
Nearby Homes
- 4408 9th Ave
- 4201 11th Ave
- 4105 10th Ave
- 704 W 46th St
- 4015 Bel Air Dr
- 3806 11th Ave
- 3901-3903 Fairacres Rd
- 4606 15th Avenue Place
- 4423 Sunset Trail
- 1707 W 43rd Street Place
- 3615 13th Ave
- Lot 1 Block 2 Fountain Hills 5th Addition
- Lot 6 Block 2 Fountain Hills 5th Additon
- TBD 11th Street Fountain Hills
- 5306 11th Ave
- 3506 13th Ave
- 3407 10th Ave
- 1410 W 36th St
- 516 W 36th St
- 17th 56th Street Tract C Unit Tract C
- 4504 10th Ave
- 4510 9th Avenue Place
- 4508 9th Avenue Place
- 4506 10th Ave
- 1012 W 45th St
- 1004 W 45th St
- 4512 9th Avenue Place
- 4403 11th Ave
- 4404 10th Ave
- 4410 9th Ave
- 4407 10th Avenue Place
- 4403 10th Ave
- 4406 11th Ave
- 4507 9th Avenue Place
- 1105 W 45th Street Place
- 4511 9th Avenue Place
- 4508 10th Ave
- 4209 11th Ave
- 4509 9th Avenue Place
- 4506 11th Ave