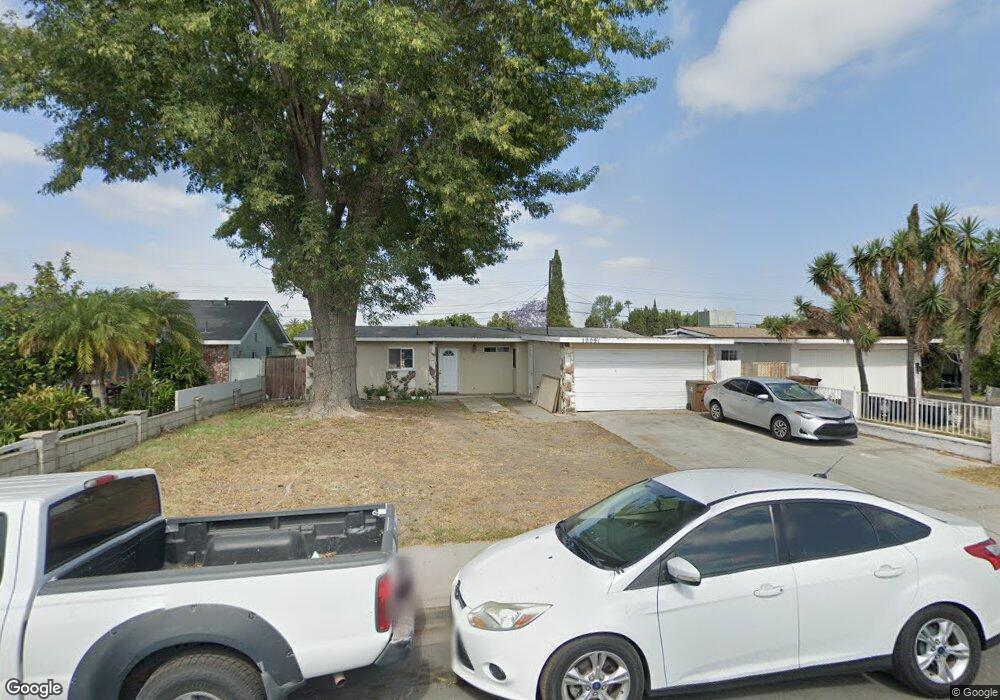
10091 Gravier St Anaheim, CA 92804
West Anaheim NeighborhoodEstimated Value: $774,000 - $897,000
4
Beds
2
Baths
1,165
Sq Ft
$733/Sq Ft
Est. Value
About This Home
This home is located at 10091 Gravier St, Anaheim, CA 92804 and is currently estimated at $854,171, approximately $733 per square foot. 10091 Gravier St is a home located in Orange County with nearby schools including Walt Disney Elementary School, Dale Jr High School, and Magnolia High.
Ownership History
Date
Name
Owned For
Owner Type
Purchase Details
Closed on
Aug 31, 2022
Sold by
Valle Family Trust
Bought by
Reboot Investments Llc
Current Estimated Value
Home Financials for this Owner
Home Financials are based on the most recent Mortgage that was taken out on this home.
Original Mortgage
$646,235
Outstanding Balance
$617,648
Interest Rate
5.3%
Mortgage Type
New Conventional
Estimated Equity
$236,523
Purchase Details
Closed on
Nov 24, 2021
Sold by
Valle Nancy
Bought by
Valle Nancy K and The Valle Family Trust Dated N
Purchase Details
Closed on
Aug 20, 2003
Sold by
Valle Nancy
Bought by
Valle Nancy
Purchase Details
Closed on
Sep 12, 2002
Sold by
Valle Salvador and Valle Nancy
Bought by
Valle Nancy
Home Financials for this Owner
Home Financials are based on the most recent Mortgage that was taken out on this home.
Original Mortgage
$180,000
Interest Rate
5.95%
Create a Home Valuation Report for This Property
The Home Valuation Report is an in-depth analysis detailing your home's value as well as a comparison with similar homes in the area
Home Values in the Area
Average Home Value in this Area
Purchase History
| Date | Buyer | Sale Price | Title Company |
|---|---|---|---|
| Reboot Investments Llc | $650,000 | -- | |
| Valle Nancy K | -- | None Available | |
| Valle Nancy | -- | Orange Coast Title Company | |
| Valle Nancy | -- | Orange Coast Title Company |
Source: Public Records
Mortgage History
| Date | Status | Borrower | Loan Amount |
|---|---|---|---|
| Open | Reboot Investments Llc | $646,235 | |
| Previous Owner | Valle Nancy | $180,000 |
Source: Public Records
Tax History Compared to Growth
Tax History
| Year | Tax Paid | Tax Assessment Tax Assessment Total Assessment is a certain percentage of the fair market value that is determined by local assessors to be the total taxable value of land and additions on the property. | Land | Improvement |
|---|---|---|---|---|
| 2025 | $8,749 | $780,300 | $722,639 | $57,661 |
| 2024 | $8,749 | $765,000 | $708,469 | $56,531 |
| 2023 | $8,506 | $750,000 | $694,577 | $55,423 |
| 2022 | $1,425 | $83,464 | $39,436 | $44,028 |
| 2021 | $1,338 | $81,828 | $38,663 | $43,165 |
| 2020 | $1,412 | $80,989 | $38,266 | $42,723 |
| 2019 | $1,388 | $79,401 | $37,515 | $41,886 |
| 2018 | $1,373 | $77,845 | $36,780 | $41,065 |
| 2017 | $1,337 | $76,319 | $36,059 | $40,260 |
| 2016 | $1,329 | $74,823 | $35,352 | $39,471 |
| 2015 | $1,408 | $73,700 | $34,821 | $38,879 |
| 2014 | $1,249 | $72,257 | $34,139 | $38,118 |
Source: Public Records
Map
Nearby Homes
- 10301 Antigua St
- 10301 Rhiems Rd
- 1250 S Brookhurst St Unit 1059
- 1250 S Brookhurst St Unit 2028
- 1250 S Brookhurst St Unit 2080
- 1250 S Brookhurst St
- 1250 S Brookhurst St Unit 2033
- 994 S Sutter Creek Rd Unit 60
- 998 S Crossbow Ln Unit 12D
- 938 S Sutter Creek Rd Unit 54
- 958 S Crossbow Ln Unit 8
- 917 S Sutter Creek Rd Unit 46
- 1350 S Ashington Ln
- 1944 W Lullaby Ln
- 2131 W Niobe Ave
- 927 S Webster Ave
- 930 S Emerald St
- 2217 W Orange Ave
- 2217 W Orange Ave Unit 18
- 2211 W Orange Ave
- 10101 Gravier St
- 10071 Gravier St
- 10111 Gravier St
- 10092 Antigua St
- 10072 Antigua St
- 10102 Antigua St
- 10112 Antigua St
- 10121 Gravier St
- 10092 Gravier St
- 10051 Gravier St
- 10102 Gravier St
- 10112 Gravier St
- 10122 Antigua St
- 10052 Antigua St
- 10131 Gravier St
- 10041 Gravier St
- 10122 Gravier St
- 10052 Gravier St
- 10132 Antigua St
- 10042 Antigua St