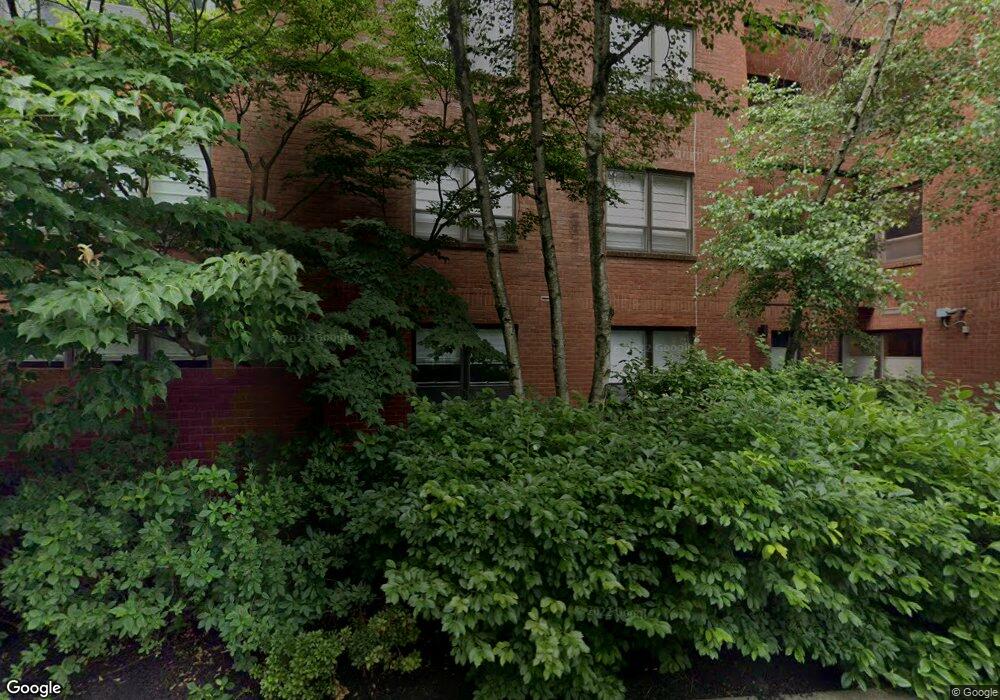
101 Cheswold Ln Unit 5H Haverford, PA 19041
Lower Merion NeighborhoodEstimated Value: $1,215,851 - $1,685,000
3
Beds
4
Baths
4,197
Sq Ft
$353/Sq Ft
Est. Value
About This Home
This home is located at 101 Cheswold Ln Unit 5H, Haverford, PA 19041 and is currently estimated at $1,480,617, approximately $352 per square foot. 101 Cheswold Ln Unit 5H is a home located in Montgomery County with nearby schools including Penn Valley School, Welsh Valley Middle School, and Harriton Senior High School.
Ownership History
Date
Name
Owned For
Owner Type
Purchase Details
Closed on
Mar 29, 2024
Sold by
Prusky Susan M
Bought by
Smp Trust and Prusky
Current Estimated Value
Purchase Details
Closed on
Feb 16, 2022
Sold by
Prusky Paul M
Bought by
Paul Prusky Irrevocable Trust
Purchase Details
Closed on
Dec 15, 2017
Sold by
Prusky Jonathan M
Bought by
Prusky Paul M and Prusky Susan M
Purchase Details
Closed on
Dec 31, 2012
Sold by
Prusky Susan M
Bought by
The Susan M Prusky Irrevocable Trust
Purchase Details
Closed on
Dec 26, 2012
Sold by
Prusky Paul and Prusky Susan M
Bought by
Prusky Susan M
Purchase Details
Closed on
May 5, 2011
Sold by
Henderson Hannah L
Bought by
Prusky Susan M and Prusky Paul
Purchase Details
Closed on
May 13, 1994
Sold by
Robb Mary Lloyd and Lloyd Wingate
Bought by
Henderson J Welles and Henderson Hannah L
Create a Home Valuation Report for This Property
The Home Valuation Report is an in-depth analysis detailing your home's value as well as a comparison with similar homes in the area
Home Values in the Area
Average Home Value in this Area
Purchase History
| Date | Buyer | Sale Price | Title Company |
|---|---|---|---|
| Smp Trust | -- | None Listed On Document | |
| Paul Prusky Irrevocable Trust | -- | None Listed On Document | |
| Prusky Paul M | -- | -- | |
| Prusky Jonathan M | -- | -- | |
| The Susan M Prusky Irrevocable Trust | -- | None Available | |
| Prusky Susan M | -- | None Available | |
| Prusky Susan M | $1,025,000 | None Available | |
| Henderson J Welles | $785,000 | Chicago Title Insurance Co |
Source: Public Records
Tax History Compared to Growth
Tax History
| Year | Tax Paid | Tax Assessment Tax Assessment Total Assessment is a certain percentage of the fair market value that is determined by local assessors to be the total taxable value of land and additions on the property. | Land | Improvement |
|---|---|---|---|---|
| 2025 | $24,828 | $594,500 | -- | -- |
| 2024 | $24,828 | $594,500 | -- | -- |
| 2023 | $23,793 | $594,500 | $0 | $0 |
| 2022 | $23,352 | $594,500 | $0 | $0 |
| 2021 | $22,820 | $594,500 | $0 | $0 |
| 2020 | $22,263 | $594,500 | $0 | $0 |
| 2019 | $21,870 | $594,500 | $0 | $0 |
| 2018 | $21,870 | $594,500 | $0 | $0 |
| 2017 | $21,066 | $594,500 | $0 | $0 |
| 2016 | $20,834 | $594,500 | $0 | $0 |
| 2015 | $19,426 | $594,500 | $0 | $0 |
| 2014 | $19,426 | $594,500 | $0 | $0 |
Source: Public Records
Map
Nearby Homes
- 101 Cheswold Ln Unit 5-E
- 101 Cheswold Ln Unit 2F
- 101 Cheswold Ln Unit 3A
- 250 Montgomery Ave Unit B
- 237 W Montgomery Ave Unit 3R
- 100 Grays Ln Unit 500
- 100 Grays Ln Unit 400
- 432 W Montgomery Ave Unit 402
- 432 Montgomery Ave Unit 401
- 264 W Montgomery Ave Unit 304
- 449 Montgomery Ave Unit 112
- 103 W Montgomery Ave Unit 1A
- 1968 W Montgomery Ave
- 236 W Spring Ave
- 216 Laurel Ln
- 302 Brentford Rd
- 530 New Gulph Rd
- 221 Ardmore Ave
- 543 Avonwood Rd
- 818 Clifford Ave
- 101 Cheswold Ln Unit 2B
- 101 Cheswold Ln Unit 2C
- 101 Cheswold Ln Unit 1C
- 101 Cheswold Ln Unit 2E
- 101 Cheswold Ln Unit 1E
- 101 Cheswold Ln Unit 3B
- 101 Cheswold Ln Unit 1G
- 101 Cheswold Ln Unit 1B
- 101 Cheswold Ln Unit 4-G
- 101 Cheswold Ln Unit 3-D
- 101 Cheswold Ln Unit 4-C
- 101 Cheswold Ln Unit 4-B
- 101 Cheswold Ln Unit 2H
- 101 Cheswold Ln Unit 2-A
- 101 Cheswold Ln
- 101 Cheswold Ln Unit 1A
- 101 Cheswold Ln Unit 3F
- 101 Cheswold Ln Unit 3G
- 101 Cheswold Ln Unit 4D
- 101 Cheswold Ln Unit 3E