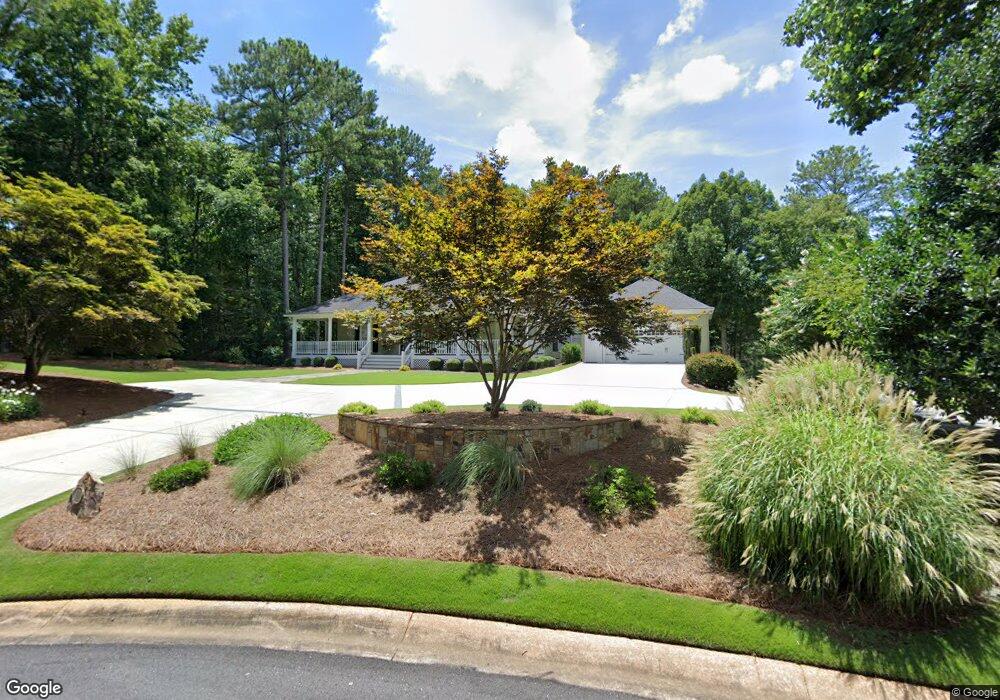
101 Country Club Ct Peachtree City, GA 30269
Estimated Value: $812,000 - $983,000
5
Beds
6
Baths
3,129
Sq Ft
$297/Sq Ft
Est. Value
About This Home
This home is located at 101 Country Club Ct, Peachtree City, GA 30269 and is currently estimated at $930,627, approximately $297 per square foot. 101 Country Club Ct is a home located in Fayette County with nearby schools including Peachtree City Elementary School, Booth Middle School, and McIntosh High School.
Ownership History
Date
Name
Owned For
Owner Type
Purchase Details
Closed on
May 7, 2024
Sold by
Hall Clay W
Bought by
Hall Clay W and Hall Tamara K
Current Estimated Value
Purchase Details
Closed on
Apr 28, 2020
Sold by
Shean William P
Bought by
Hall Clay W
Purchase Details
Closed on
Jun 20, 2001
Sold by
Clark John H and Clark Linda K
Bought by
Shean William P and Shean Elaine M
Home Financials for this Owner
Home Financials are based on the most recent Mortgage that was taken out on this home.
Original Mortgage
$265,000
Interest Rate
7.23%
Mortgage Type
New Conventional
Purchase Details
Closed on
Jan 14, 1994
Sold by
Carden Benny J and Carden Mary R
Bought by
Clark John H and Clark Linda K
Home Financials for this Owner
Home Financials are based on the most recent Mortgage that was taken out on this home.
Original Mortgage
$297,000
Interest Rate
5%
Create a Home Valuation Report for This Property
The Home Valuation Report is an in-depth analysis detailing your home's value as well as a comparison with similar homes in the area
Home Values in the Area
Average Home Value in this Area
Purchase History
| Date | Buyer | Sale Price | Title Company |
|---|---|---|---|
| Hall Clay W | -- | None Listed On Document | |
| Hall Clay W | $690,000 | -- | |
| Shean William P | $415,000 | -- | |
| Clark John H | $330,000 | -- |
Source: Public Records
Mortgage History
| Date | Status | Borrower | Loan Amount |
|---|---|---|---|
| Previous Owner | Shean William P | $265,000 | |
| Previous Owner | Clark John H | $297,000 |
Source: Public Records
Tax History Compared to Growth
Tax History
| Year | Tax Paid | Tax Assessment Tax Assessment Total Assessment is a certain percentage of the fair market value that is determined by local assessors to be the total taxable value of land and additions on the property. | Land | Improvement |
|---|---|---|---|---|
| 2024 | $10,069 | $340,672 | $60,000 | $280,672 |
| 2023 | $9,920 | $327,000 | $60,000 | $267,000 |
| 2022 | $9,572 | $316,040 | $60,000 | $256,040 |
| 2021 | $8,387 | $273,000 | $60,000 | $213,000 |
| 2020 | $7,484 | $243,000 | $38,000 | $205,000 |
| 2019 | $6,642 | $213,800 | $38,000 | $175,800 |
| 2018 | $6,393 | $202,600 | $38,000 | $164,600 |
| 2017 | $5,861 | $184,680 | $38,000 | $146,680 |
| 2016 | $6,366 | $193,160 | $38,000 | $155,160 |
| 2015 | $6,003 | $179,320 | $38,000 | $141,320 |
| 2014 | $5,764 | $169,320 | $38,000 | $131,320 |
| 2013 | -- | $167,600 | $0 | $0 |
Source: Public Records
Map
Nearby Homes
- 108 Madison Ave
- 221 N Cove Dr
- 103 Greensway
- 106 Sandtrap Ridge
- 330 N Peachtree Pkwy
- 15 Perthshire Dr
- 522 Golfview Dr
- 522 Golf View Dr
- 36 Fairway Ln
- 20 Fairway Ln
- 107 Rolling Green
- 1000 Blair Ln
- 930 Laurel Brooke Ave
- 606 Wingspread
- 12 Northlake Cir
- 2403 Ashford Park
- 406 Daker Dr
- 527 Hazelnut Dr
- 115 Edgewater Way
- 110 Paddock Trail
- 1225 Country Club Ct
- 103 Country Club Ct
- 104 Country Club Ct
- 0 Country Club Ct Unit 7105662
- 0 Country Club Ct
- 102 Country Club Ct
- 100 Country Club Ct
- 100 Madison Ave
- 605 Flat Creek Rd
- 102 Madison Ave
- 104 Madison Ave
- 106 Madison Ave
- 0 Madison Ave Unit 8338809
- 0 Madison Ave Unit 3139899
- 0 Madison Ave Unit 8403782
- 0 Madison Ave Unit 8278792
- 0 Madison Ave Unit 8474120
- 0 Madison Ave Unit 8453352
- 0 Madison Ave Unit 8433041
- 0 Madison Ave Unit 8824668