Estimated Value: $1,041,407
--
Bed
--
Bath
5,005
Sq Ft
$208/Sq Ft
Est. Value
About This Home
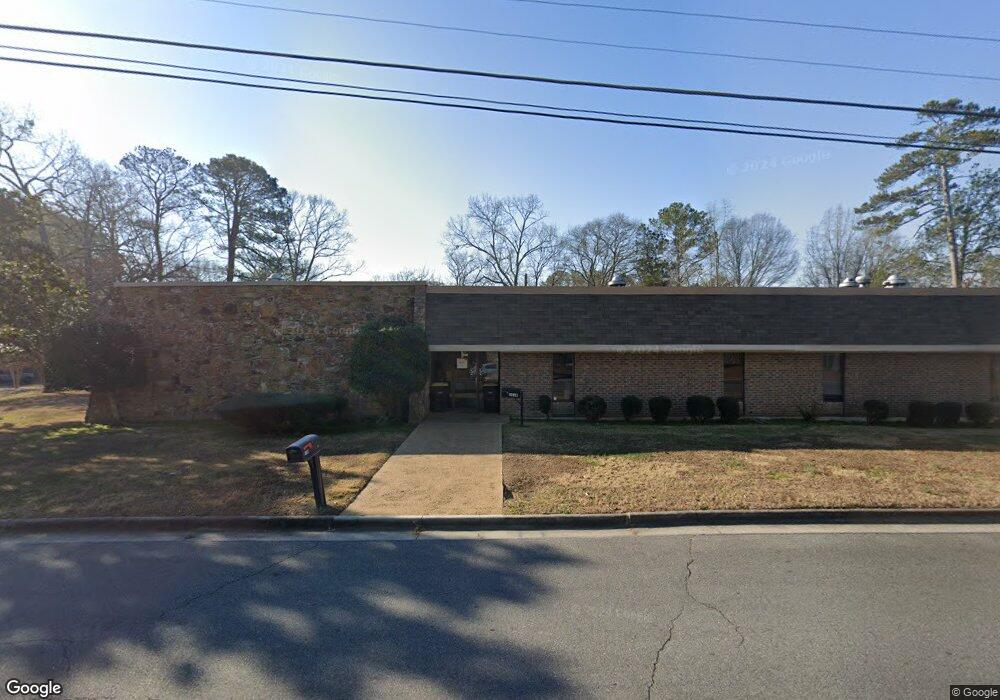
This home is located at 101 John Maddox Dr NW, Rome, GA 30165 and is currently estimated at $1,041,407, approximately $208 per square foot. 101 John Maddox Dr NW is a home located in Floyd County with nearby schools including Rome High School.
Ownership History
Date
Name
Owned For
Owner Type
Purchase Details
Closed on
Feb 7, 2014
Sold by
Jagiella Audrone Kulikausk
Bought by
Nwaedozie Azuka
Current Estimated Value
Home Financials for this Owner
Home Financials are based on the most recent Mortgage that was taken out on this home.
Original Mortgage
$366,792
Interest Rate
4.55%
Mortgage Type
Commercial
Purchase Details
Closed on
Jun 3, 2013
Sold by
Jagiella I Aleksandra
Bought by
Jagiella Audrone Kulikauskaite
Purchase Details
Closed on
Dec 18, 2006
Sold by
Not Provided
Bought by
Jagiella Walter J 58 73 and Waclav J Jagiella 41 27
Purchase Details
Closed on
Jun 22, 1995
Sold by
Waldrep Jack M Sr 41 and 27%
Bought by
Jagiella Walter J 58 and 73%
Purchase Details
Closed on
Dec 31, 1986
Sold by
Waldrep Jack M and Connor Robert T T
Bought by
Waldrep Jack M Sr 41 and 27%
Purchase Details
Closed on
Dec 6, 1971
Bought by
Waldrep Jack M and Conn Robert T T
Create a Home Valuation Report for This Property
The Home Valuation Report is an in-depth analysis detailing your home's value as well as a comparison with similar homes in the area
Home Values in the Area
Average Home Value in this Area
Purchase History
| Date | Buyer | Sale Price | Title Company |
|---|---|---|---|
| Nwaedozie Azuka | $400,000 | -- | |
| Jagiella Audrone Kulikauskaite | -- | -- | |
| Jagiella Walter J 58 73 | -- | -- | |
| Jagiella Walter J 58 73 | -- | -- | |
| Jagiella Walter J 58 | $150,000 | -- | |
| Waldrep Jack M Sr 41 | $155,000 | -- | |
| Waldrep Jack M | $27,500 | -- |
Source: Public Records
Mortgage History
| Date | Status | Borrower | Loan Amount |
|---|---|---|---|
| Closed | Nwaedozie Azuka | $366,792 |
Source: Public Records
Tax History Compared to Growth
Tax History
| Year | Tax Paid | Tax Assessment Tax Assessment Total Assessment is a certain percentage of the fair market value that is determined by local assessors to be the total taxable value of land and additions on the property. | Land | Improvement |
|---|---|---|---|---|
| 2024 | $7,123 | $201,140 | $49,946 | $151,194 |
| 2023 | $5,906 | $168,187 | $49,946 | $118,241 |
| 2022 | $5,591 | $153,209 | $42,811 | $110,398 |
| 2021 | $5,676 | $152,967 | $42,811 | $110,156 |
| 2020 | $5,726 | $153,033 | $42,811 | $110,222 |
| 2019 | $5,474 | $147,889 | $42,811 | $105,078 |
| 2018 | $5,540 | $149,654 | $42,811 | $106,843 |
| 2017 | $5,606 | $151,419 | $42,811 | $108,608 |
| 2016 | $5,721 | $154,052 | $42,800 | $111,252 |
| 2015 | -- | $154,052 | $42,800 | $111,252 |
| 2014 | -- | $154,052 | $42,800 | $111,252 |
Source: Public Records
Map
Nearby Homes
- 614 Briarwood Cir NW
- 808 Charlton St NW
- 208 Dodd St NW
- 204 Oakwood St NW
- 7 Raymond Ave NW
- 105 Robin St NW
- 124 Sheridan Dr NW
- 23 Sweetspire Dr NW
- 21 Sweetspire Dr NW
- 15 Silverbell Ln
- 0 Unbridled Rd Unit 22 23074684
- 4 Colonial Dr NW
- 214 N Elm St NW
- 8 S Hughes St SW
- 209 Sherwood Rd SW
- 9 Shorter Cir SW
- 3 Berckman Ln SW
- 19 Berckman Ln SW
- 101 John Maddox Dr NW Unit A
- 101 John Maddox Dr NW Unit B
- 616 Briarwood Cir NW
- 612 Briarwood Cir NW
- 611 Briarwood Cir NW Unit 55
- 611 Briarwood Cir NW
- 609 Briarwood Cir NW Unit 53
- 609 Briarwood Cir NW
- 607 Briarwood Cir NW
- 613 Briarwood Cir NW
- 610 Briarwood Cir NW
- 0 Briarwood Cir NW Unit 7364598
- 0 Briarwood Cir NW Unit 8689868
- 0 Briarwood Cir NW Unit 8551890
- 0 Briarwood Cir NW Unit 8317321
- 0 Briarwood Cir NW Unit 8153200
- 0 Briarwood Cir NW Unit 7593301
- 0 Briarwood Cir NW Unit 7573591
- 0 Briarwood Cir NW Unit 7506856
- 0 Briarwood Cir NW Unit 8173118