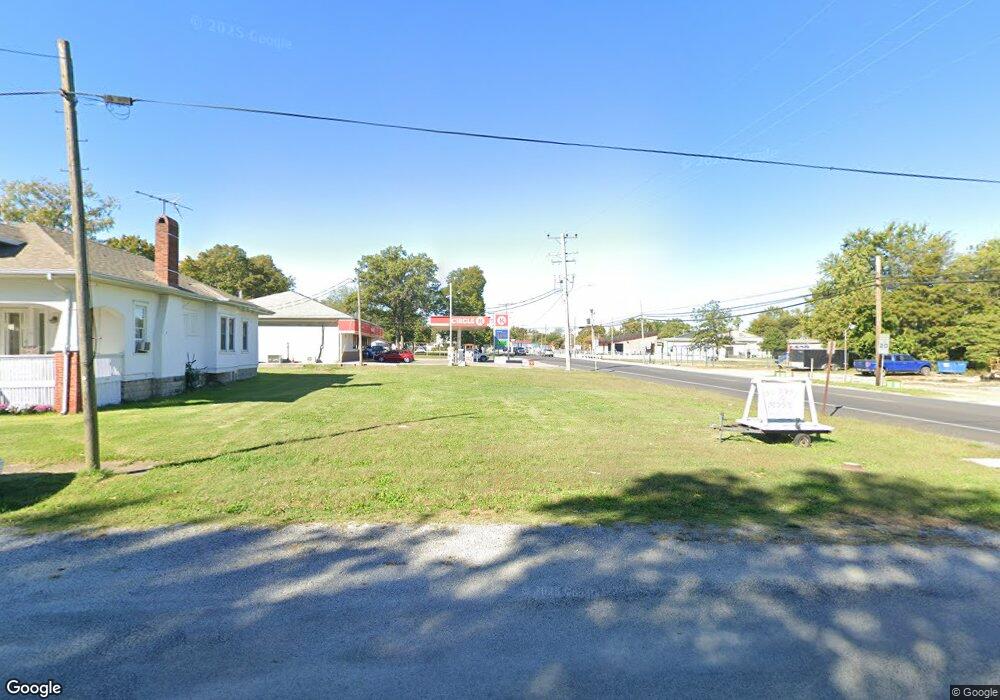
101 S 5th St Coulterville, IL 62237
Estimated Value: $22,953
3
Beds
2
Baths
1,284
Sq Ft
$18/Sq Ft
Est. Value
About This Home
This home is located at 101 S 5th St, Coulterville, IL 62237 and is currently priced at $22,953, approximately $17 per square foot. 101 S 5th St is a home located in Randolph County with nearby schools including Coulterville CUSD 1, Coulterville Junior High School, and Coulterville High School.
Ownership History
Date
Name
Owned For
Owner Type
Purchase Details
Closed on
Aug 19, 2019
Sold by
Village Of Coulterville
Bought by
Jackson Rodney E
Current Estimated Value
Purchase Details
Closed on
Apr 17, 2019
Sold by
Buckentin Carol Ann and Buckentin William
Bought by
Village Of Coulterville
Purchase Details
Closed on
Jul 13, 2010
Sold by
Cobble Jerry
Bought by
Arbeiter Ronald W
Purchase Details
Closed on
Jun 1, 2009
Sold by
Ib Property Holdings Llc
Bought by
Cobble Jerry
Purchase Details
Closed on
Jul 2, 2008
Sold by
Jackson Douglas and Jackson Cherri
Bought by
Bennett Terri
Purchase Details
Closed on
Jun 7, 2006
Sold by
Jackson Douglas Brent
Bought by
Bayview Financial Property Person
Purchase Details
Closed on
May 6, 2005
Sold by
Spade Joe
Bought by
Jackson Cheri
Create a Home Valuation Report for This Property
The Home Valuation Report is an in-depth analysis detailing your home's value as well as a comparison with similar homes in the area
Home Values in the Area
Average Home Value in this Area
Purchase History
| Date | Buyer | Sale Price | Title Company |
|---|---|---|---|
| Jackson Rodney E | -- | None Available | |
| Village Of Coulterville | -- | None Available | |
| Buckentin Carol Ann | -- | None Available | |
| Arbeiter Ronald W | $2,500 | None Available | |
| Cobble Jerry | $5,000 | None Available | |
| Bennett Terri | -- | None Available | |
| Bayview Financial Property Person | $20,500 | None Available | |
| Jackson Cheri | -- | None Available |
Source: Public Records
Tax History Compared to Growth
Tax History
| Year | Tax Paid | Tax Assessment Tax Assessment Total Assessment is a certain percentage of the fair market value that is determined by local assessors to be the total taxable value of land and additions on the property. | Land | Improvement |
|---|---|---|---|---|
| 2024 | $8 | $95 | $95 | $0 |
| 2023 | $8 | $90 | $90 | $0 |
| 2022 | $8 | $90 | $90 | $0 |
| 2021 | $45 | $525 | $525 | $0 |
| 2020 | $50 | $542 | $542 | $0 |
| 2019 | $135 | $1,560 | $535 | $1,025 |
| 2018 | $1,043 | $12,888 | $1,593 | $11,295 |
| 2017 | $959 | $11,795 | $1,460 | $10,335 |
| 2016 | $916 | $11,365 | $1,405 | $9,960 |
| 2015 | $986 | $11,365 | $1,405 | $9,960 |
| 2014 | $986 | $11,590 | $1,435 | $10,155 |
| 2013 | $964 | $11,740 | $1,455 | $10,285 |
Source: Public Records
Map
Nearby Homes
- 115 S 4th St
- 9199 Schupbach Rd
- 302 Walnut St
- 521 Cherry St
- 378 Butler St
- 751 Torrens St
- 2076 Carter Rd
- 718 N Illinois St
- 331 N Minnie Ave
- 2821 N Market St
- 143 Taft St
- 2125 N Market St
- 0 Flamingo Dr
- 1821 Mark Dr
- 151 Doc Lin Dr
- 1019 E Broadway St
- 712 E Harrison St
- 520 E Mound St
- 1125 N Market St
- 540 E Broadway St
