1010 1010 Leroy Bellamy Rd Inverness, FL 34450
Estimated Value: $134,000 - $235,000
3
Beds
1
Bath
1,025
Sq Ft
$194/Sq Ft
Est. Value
About This Home
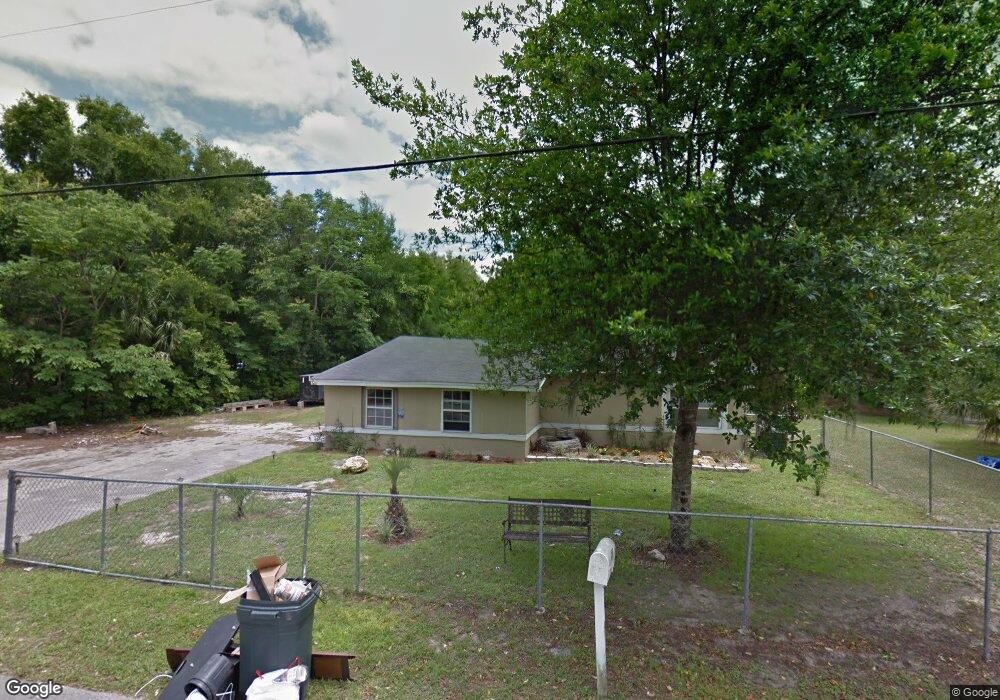
This home is located at 1010 1010 Leroy Bellamy Rd, Inverness, FL 34450 and is currently estimated at $198,801, approximately $193 per square foot. 1010 1010 Leroy Bellamy Rd is a home located in Citrus County with nearby schools including Inverness Primary School, Inverness Middle School, and Citrus High School.
Ownership History
Date
Name
Owned For
Owner Type
Purchase Details
Closed on
Dec 14, 2023
Sold by
Garmas Pedro
Bought by
Seaton Tiffany Dawn and Seaton Trista M
Current Estimated Value
Home Financials for this Owner
Home Financials are based on the most recent Mortgage that was taken out on this home.
Original Mortgage
$10,475
Outstanding Balance
$10,308
Interest Rate
7.44%
Estimated Equity
$188,493
Purchase Details
Closed on
Dec 19, 2022
Sold by
Holten Tamara Nicole
Bought by
Garmas Pedro
Purchase Details
Closed on
Mar 4, 2020
Sold by
Tenner Larry
Bought by
Tenner Larry and Ivey Shirley R
Purchase Details
Closed on
Oct 11, 2006
Sold by
Ivey Shirley R
Bought by
Muson Larry Fenner
Purchase Details
Closed on
Oct 1, 2006
Bought by
Tenner Larry
Purchase Details
Closed on
May 19, 2004
Sold by
Simmons Merrick
Bought by
Ivey Shirley
Purchase Details
Closed on
Oct 1, 1989
Bought by
Tenner Larry
Create a Home Valuation Report for This Property
The Home Valuation Report is an in-depth analysis detailing your home's value as well as a comparison with similar homes in the area
Home Values in the Area
Average Home Value in this Area
Purchase History
| Date | Buyer | Sale Price | Title Company |
|---|---|---|---|
| Seaton Tiffany Dawn | $222,000 | Southern Security Title | |
| Seaton Tiffany Dawn | $222,000 | Southern Security Title | |
| Seaton Tiffany Dawn | $222,000 | Southern Security Title | |
| Garmas Pedro | $78,000 | American Title Services | |
| Tenner Larry | -- | None Available | |
| Muson Larry Fenner | -- | None Available | |
| Tenner Larry | $100 | -- | |
| Ivey Shirley | $35,000 | American Title Services Of C | |
| Tenner Larry | $100 | -- |
Source: Public Records
Mortgage History
| Date | Status | Borrower | Loan Amount |
|---|---|---|---|
| Open | Seaton Tiffany Dawn | $10,475 | |
| Closed | Seaton Tiffany Dawn | $10,475 | |
| Open | Seaton Tiffany Dawn | $209,500 | |
| Closed | Seaton Tiffany Dawn | $209,500 |
Source: Public Records
Tax History Compared to Growth
Tax History
| Year | Tax Paid | Tax Assessment Tax Assessment Total Assessment is a certain percentage of the fair market value that is determined by local assessors to be the total taxable value of land and additions on the property. | Land | Improvement |
|---|---|---|---|---|
| 2024 | $1,524 | $113,771 | $5,130 | $108,641 |
| 2023 | $1,524 | $68,761 | $5,130 | $63,631 |
| 2022 | $1,132 | $55,966 | $5,130 | $50,836 |
| 2021 | $1,000 | $46,510 | $5,130 | $41,380 |
| 2020 | $989 | $43,560 | $5,130 | $38,430 |
| 2019 | $689 | $31,840 | $5,130 | $26,710 |
| 2018 | $0 | $30,360 | $4,800 | $25,560 |
| 2017 | $563 | $24,617 | $4,800 | $19,817 |
| 2016 | $0 | $19,383 | $4,800 | $14,583 |
| 2015 | -- | $19,248 | $4,120 | $15,128 |
| 2014 | -- | $20,160 | $3,944 | $16,216 |
Source: Public Records
Map
Nearby Homes
- 1006 Leroy Bellamy Rd
- 415 Abel Point
- 475 Landing Blvd
- 509 Henson Point
- 1302 Cypress Cove Ct
- 1423 Longboat Point
- 1220 Mossy Oak Dr
- 1212 Cypress Cove Ct
- 1288 Cypress Cove Ct
- 1336 Cypress Cove Ct
- 2001 Us Highway 41 S
- 722 Nola St
- 1104 Lake Shore Dr
- 1308 Lakeshore Dr
- 405 E Circlewood St
- 130 Blanton Dr
- 1316 Eden Dr
- 1406 Eden Dr
- 1940 S Mooring Dr
- 1880 S Westlake Dr
- 1010 Leroy Bellamy Rd
- 1002 Leroy Bellamy Rd
- 1001 Leroy Bellamy Rd
- 320 Stotler Ave
- 920 Leroy Bellamy Rd
- 1133 Mossy Oak Dr
- 1133 Mossy Oak Dr
- 917 Leroy Bellamy Rd
- 918 Leroy Bellamy Rd
- 316 Stotler Ave
- 918 Sawyer St
- 313 Stotler Ave
- 917 Louis St
- 913 Leroy Bellamy Rd
- 312 Stotler Ave
- 429 Landings
- 429 Landing Blvd
- 431 Landing Blvd
- 433 Landing Blvd
- 419 Landing Blvd