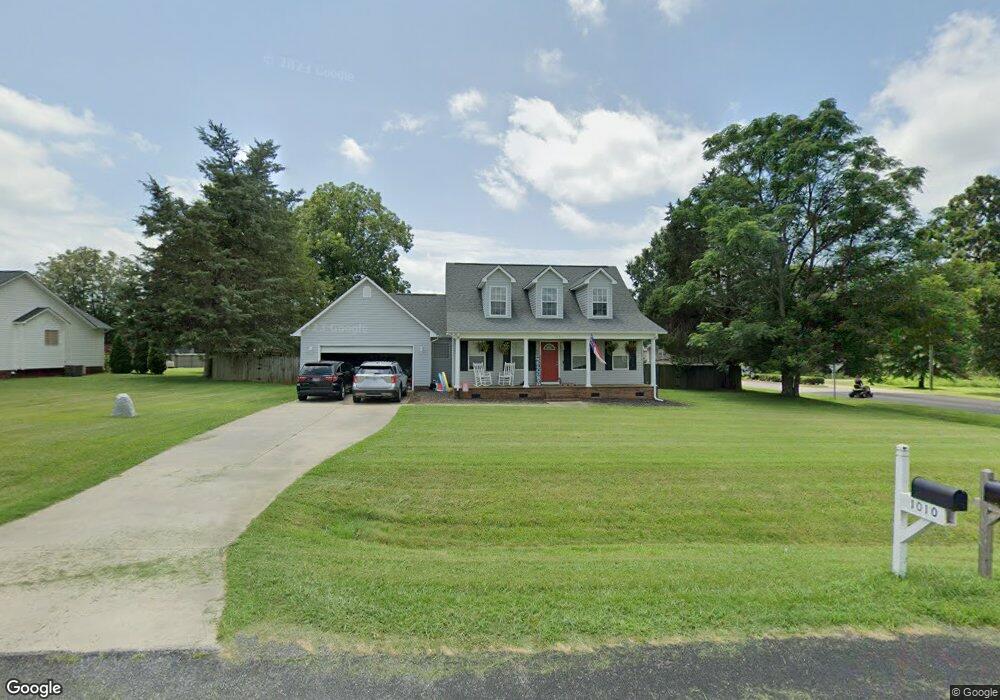
1010 Auborn Place Salisbury, NC 28147
Estimated Value: $340,000 - $357,000
3
Beds
3
Baths
1,624
Sq Ft
$216/Sq Ft
Est. Value
About This Home
This home is located at 1010 Auborn Place, Salisbury, NC 28147 and is currently estimated at $350,792, approximately $216 per square foot. 1010 Auborn Place is a home located in Rowan County with nearby schools including Knollwood Elementary School, Southeast Middle School, and West Rowan High School.
Ownership History
Date
Name
Owned For
Owner Type
Purchase Details
Closed on
May 10, 2019
Sold by
Shoemaker Wendy P and Shoemaker Cortley Scott
Bought by
Ratledge Adam M and Gullett Casey N
Current Estimated Value
Home Financials for this Owner
Home Financials are based on the most recent Mortgage that was taken out on this home.
Original Mortgage
$184,990
Outstanding Balance
$161,980
Interest Rate
4%
Mortgage Type
New Conventional
Estimated Equity
$188,812
Purchase Details
Closed on
Feb 20, 2015
Sold by
Wilmington Savings Fund Society Fsb
Bought by
Livengood Wendy P
Home Financials for this Owner
Home Financials are based on the most recent Mortgage that was taken out on this home.
Original Mortgage
$143,075
Interest Rate
3.81%
Mortgage Type
New Conventional
Purchase Details
Closed on
Jul 17, 2014
Sold by
Kennedy Jason N and Kennedy Amica J
Bought by
Wilmington Savings Fund Society Fsb
Purchase Details
Closed on
Feb 8, 2006
Sold by
Plantation Ridge
Bought by
Kennedy Jason N and Kennedy Amica J
Home Financials for this Owner
Home Financials are based on the most recent Mortgage that was taken out on this home.
Original Mortgage
$127,920
Interest Rate
7.38%
Mortgage Type
Fannie Mae Freddie Mac
Create a Home Valuation Report for This Property
The Home Valuation Report is an in-depth analysis detailing your home's value as well as a comparison with similar homes in the area
Home Values in the Area
Average Home Value in this Area
Purchase History
| Date | Buyer | Sale Price | Title Company |
|---|---|---|---|
| Ratledge Adam M | $196,000 | None Available | |
| Livengood Wendy P | $147,500 | None Available | |
| Wilmington Savings Fund Society Fsb | $164,500 | Servicelink | |
| Kennedy Jason N | $159,500 | Chicago Title Insurance Co |
Source: Public Records
Mortgage History
| Date | Status | Borrower | Loan Amount |
|---|---|---|---|
| Open | Ratledge Adam M | $184,990 | |
| Previous Owner | Livengood Wendy P | $143,075 | |
| Previous Owner | Kennedy Jason N | $127,920 | |
| Previous Owner | Kennedy Jason N | $31,980 |
Source: Public Records
Tax History Compared to Growth
Tax History
| Year | Tax Paid | Tax Assessment Tax Assessment Total Assessment is a certain percentage of the fair market value that is determined by local assessors to be the total taxable value of land and additions on the property. | Land | Improvement |
|---|---|---|---|---|
| 2025 | $1,717 | $253,410 | $35,000 | $218,410 |
| 2024 | $1,717 | $253,410 | $35,000 | $218,410 |
| 2023 | $1,717 | $253,410 | $35,000 | $218,410 |
| 2022 | $1,248 | $165,234 | $28,500 | $136,734 |
| 2021 | $1,235 | $165,234 | $28,500 | $136,734 |
| 2020 | $1,235 | $165,234 | $28,500 | $136,734 |
| 2019 | $1,235 | $165,234 | $28,500 | $136,734 |
| 2018 | $1,127 | $152,046 | $28,500 | $123,546 |
| 2017 | $1,127 | $152,046 | $28,500 | $123,546 |
| 2016 | $1,127 | $152,046 | $28,500 | $123,546 |
| 2015 | $1,140 | $152,046 | $28,500 | $123,546 |
| 2014 | $982 | $137,290 | $21,500 | $115,790 |
Source: Public Records
Map
Nearby Homes
- 1348 Greenheather Dr
- 215 Autumn Chapel Dr
- 155 Putney Ct
- 328 Bramblewood Dr
- 2885 Wright Ave
- 4712 Mooresville Rd
- 4710 Mooresville Rd
- 110 Venture Dr
- 308 Hickory Ln
- 130 Lois Ln
- 000 Mooresville Rd
- 3080 Shue Rd
- 540 Roger Dr
- 202 Bayberry Dr
- 290 Roger Dr
- 161 Moore Haven Dr
- 201 Bayberry Dr
- 101 Bayberry Dr
- 210 Hollybrook Ct
- 335 Bonaventure Dr
- 1036 Auborn Place
- 129 Chase Dr
- 1005 Auborn Place
- 1005 Auburn Place
- 205 Chase Dr
- 111 Autumn Chapel Dr
- 1371 Greenheather Dr
- 1368 Greenheather Dr
- 1104 Auborn Place
- 227 Chase Dr
- 238 Chase Dr
- 137 Autumn Chapel Dr
- 1125 Auborn Place
- 1339 Greenheather Dr
- 124 Autumn Chapel Dr
- 1132 Auborn Place
- 1356 Greenheather Dr
- 241 Chase Dr
- 266 Chase Dr
- 161 Autumn Chapel Dr