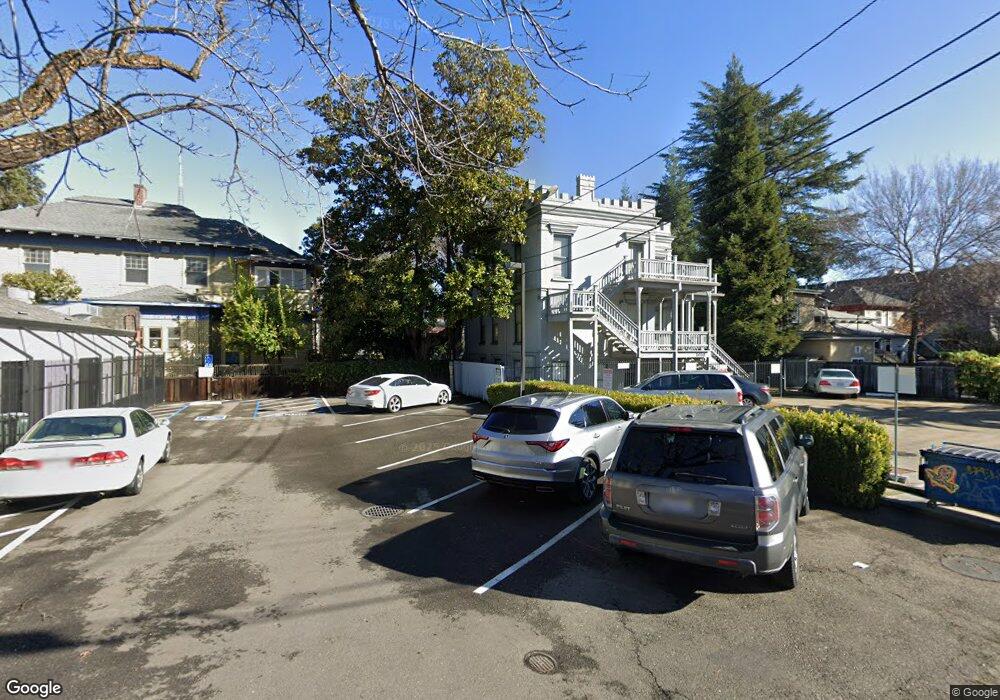
1010 F St Sacramento, CA 95814
Alkali Flat Neighborhood
--
Bed
--
Bath
--
Sq Ft
0.27
Acres
About This Home
This home is located at 1010 F St, Sacramento, CA 95814. 1010 F St is a home located in Sacramento County with nearby schools including Washington Elementary, Miwok Middle School, and C. K. McClatchy High.
Ownership History
Date
Name
Owned For
Owner Type
Purchase Details
Closed on
Sep 25, 2001
Sold by
Interbay Funding Llc
Bought by
Crable Richard E and Crable Jane C
Home Financials for this Owner
Home Financials are based on the most recent Mortgage that was taken out on this home.
Original Mortgage
$435,000
Interest Rate
6.67%
Mortgage Type
Commercial
Purchase Details
Closed on
Apr 16, 2001
Sold by
Chong Carmen Lam and Chong Ann Lynn
Bought by
Interbay Funding Llc
Purchase Details
Closed on
Jan 28, 1995
Sold by
Nunenkamp David C
Bought by
Chong Ann Lynn
Create a Home Valuation Report for This Property
The Home Valuation Report is an in-depth analysis detailing your home's value as well as a comparison with similar homes in the area
Home Values in the Area
Average Home Value in this Area
Purchase History
| Date | Buyer | Sale Price | Title Company |
|---|---|---|---|
| Crable Richard E | $580,000 | Fidelity National Title Co | |
| Interbay Funding Llc | $388,714 | -- | |
| Chong Ann Lynn | -- | -- |
Source: Public Records
Mortgage History
| Date | Status | Borrower | Loan Amount |
|---|---|---|---|
| Previous Owner | Crable Richard E | $435,000 |
Source: Public Records
Tax History Compared to Growth
Tax History
| Year | Tax Paid | Tax Assessment Tax Assessment Total Assessment is a certain percentage of the fair market value that is determined by local assessors to be the total taxable value of land and additions on the property. | Land | Improvement |
|---|---|---|---|---|
| 2025 | $10,234 | $856,811 | $280,676 | $576,135 |
| 2024 | $10,234 | $840,012 | $275,173 | $564,839 |
| 2023 | $9,996 | $823,542 | $269,778 | $553,764 |
| 2022 | $9,831 | $807,395 | $264,489 | $542,906 |
| 2021 | $9,371 | $791,564 | $259,303 | $532,261 |
| 2020 | $9,450 | $783,449 | $256,645 | $526,804 |
| 2019 | $9,252 | $768,088 | $251,613 | $516,475 |
| 2018 | $9,016 | $753,029 | $246,680 | $506,349 |
| 2017 | $8,898 | $738,265 | $241,844 | $496,421 |
| 2016 | $8,713 | $723,790 | $237,102 | $486,688 |
| 2015 | $8,591 | $712,919 | $233,541 | $479,378 |
| 2014 | $8,363 | $698,955 | $228,967 | $469,988 |
Source: Public Records
Map
Nearby Homes