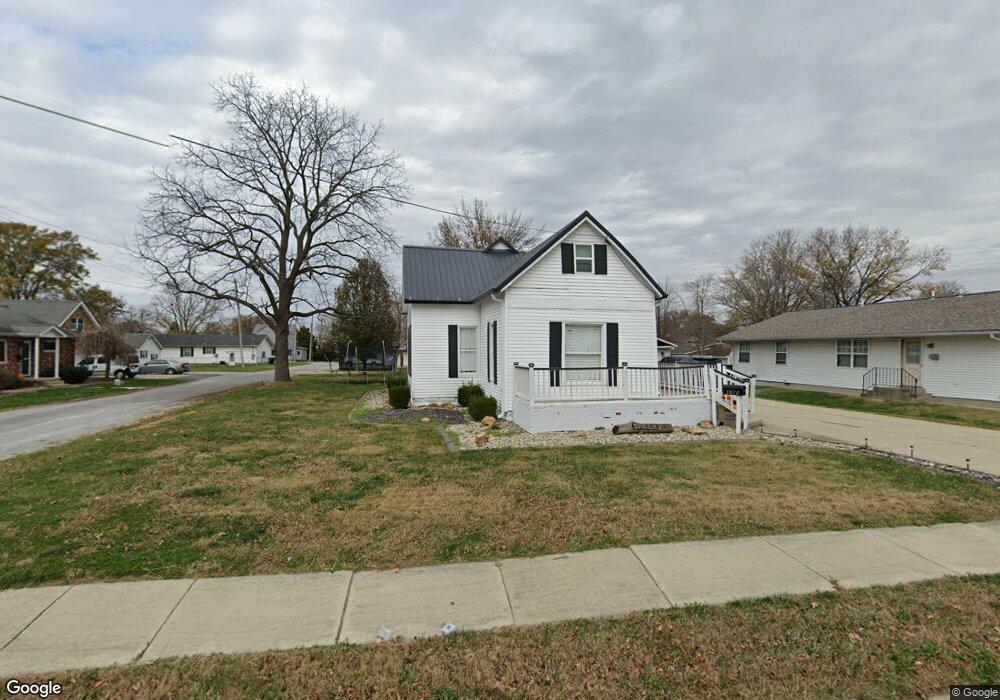
1010 W Saint Anthony Ave Effingham, IL 62401
Estimated Value: $127,000 - $369,000
4
Beds
1
Bath
1,653
Sq Ft
$122/Sq Ft
Est. Value
About This Home
This home is located at 1010 W Saint Anthony Ave, Effingham, IL 62401 and is currently estimated at $201,849, approximately $122 per square foot. 1010 W Saint Anthony Ave is a home located in Effingham County with nearby schools including South Side Grade School, Early Learning Center, and Central Grade School.
Ownership History
Date
Name
Owned For
Owner Type
Purchase Details
Closed on
Jul 22, 2020
Sold by
Mayhood Mark E and Mayhood Dianne Y
Bought by
Martinez Santa Flores and Martinez Mario G
Current Estimated Value
Purchase Details
Closed on
Jan 11, 2016
Sold by
Zumbahlen Rhett R
Bought by
Mayhood Mark E and Mayhood Dianne Y
Purchase Details
Closed on
Sep 28, 2006
Sold by
Walker Amber and Walker Michael
Bought by
Zumbahlen Rhett R
Purchase Details
Closed on
Jan 11, 2006
Sold by
Coleman Francislindell and Walker Amber
Bought by
Walker Amber and Walker Michael
Purchase Details
Closed on
Mar 28, 2005
Sold by
Coleman Francis Lindell
Bought by
Coleman Francis Lindell and Walker Amber
Home Financials for this Owner
Home Financials are based on the most recent Mortgage that was taken out on this home.
Original Mortgage
$60,600
Interest Rate
9.75%
Mortgage Type
Adjustable Rate Mortgage/ARM
Create a Home Valuation Report for This Property
The Home Valuation Report is an in-depth analysis detailing your home's value as well as a comparison with similar homes in the area
Home Values in the Area
Average Home Value in this Area
Purchase History
| Date | Buyer | Sale Price | Title Company |
|---|---|---|---|
| Martinez Santa Flores | $77,000 | Attorney | |
| Mayhood Mark E | $75,500 | None Available | |
| Zumbahlen Rhett R | $48,000 | None Available | |
| Walker Amber | -- | Nations Title Agency Inc | |
| Coleman Francis Lindell | -- | Nations Title Agency Inc |
Source: Public Records
Mortgage History
| Date | Status | Borrower | Loan Amount |
|---|---|---|---|
| Previous Owner | Coleman Francis Lindell | $60,600 |
Source: Public Records
Tax History Compared to Growth
Tax History
| Year | Tax Paid | Tax Assessment Tax Assessment Total Assessment is a certain percentage of the fair market value that is determined by local assessors to be the total taxable value of land and additions on the property. | Land | Improvement |
|---|---|---|---|---|
| 2024 | $2,404 | $35,590 | $12,410 | $23,180 |
| 2023 | $2,203 | $32,350 | $11,280 | $21,070 |
| 2022 | $1,656 | $29,680 | $10,350 | $19,330 |
| 2021 | $1,697 | $29,390 | $10,250 | $19,140 |
| 2020 | $2,093 | $28,560 | $9,960 | $18,600 |
| 2019 | $2,054 | $28,280 | $9,860 | $18,420 |
| 2018 | $1,987 | $27,190 | $9,480 | $17,710 |
| 2017 | $1,953 | $26,650 | $9,290 | $17,360 |
| 2016 | $1,911 | $25,870 | $9,020 | $16,850 |
| 2015 | -- | $25,120 | $8,760 | $16,360 |
| 2014 | -- | $24,380 | $8,500 | $15,880 |
| 2013 | -- | $23,900 | $8,330 | $15,570 |
| 2012 | -- | $23,550 | $8,210 | $15,340 |
Source: Public Records
Map
Nearby Homes
- 0 Augusta National Dr Unit 6255461
- 0 S Lakewood Dr
- 702 W Fayette Ave
- 710 W Richland Ave
- 1600 W Fayette Ave
- 406 W Kentucky Ave
- 407 W Edgar Ave
- 601 S Maple St
- 1006 N Koester Dr
- 100 E Temple Ave
- 602 S 5th St
- 505 W Evergreen Ave
- 1105 N Merchant St
- 1201 N Martin St
- 812 S 4th St
- 104 S Willow St
- 603 E Saint Louis Ave
- 801 N Cleveland St
- 1005 S 3rd St
- 805 N Glenwood St
- 1006 W Saint Anthony Ave
- 303 N Vine St
- 1004 W Saint Anthony Ave
- 1009 W Saint Louis Ave
- 1102 W Saint Anthony Ave
- 1007 W Saint Louis Ave
- 1009 W Street Louis Ave
- 1007 W Street Louis Ave
- 1009 W Saint Anthony Ave
- 1007 W Saint Anthony Ave
- 1101 W Saint Louis Ave
- 1005 W Saint Louis Ave
- 1104 W Saint Anthony Ave
- 1101 W Saint Anthony Ave
- 1101 W Street Louis Ave
- 1005 W Street Louis Ave
- 1000 W Saint Anthony Ave
- 305 N Oak St
- 1103 W Saint Anthony Ave
- 1106 W Saint Anthony Ave