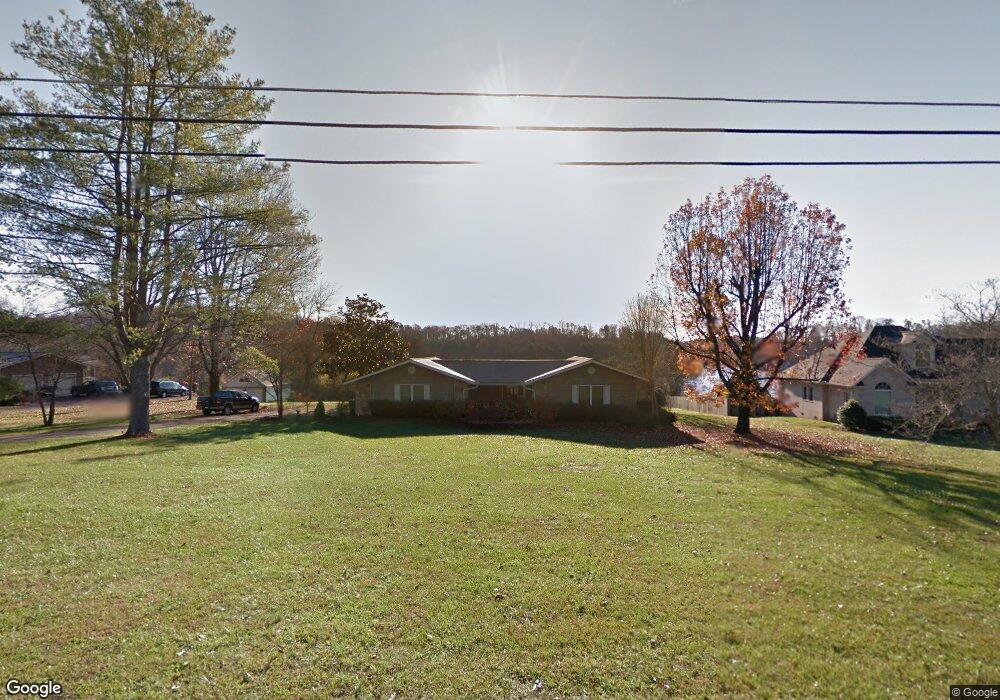
10100 El Pinar Dr Knoxville, TN 37922
Concord NeighborhoodEstimated Value: $725,000 - $863,000
5
Beds
3
Baths
4,464
Sq Ft
$184/Sq Ft
Est. Value
About This Home
This home is located at 10100 El Pinar Dr, Knoxville, TN 37922 and is currently estimated at $823,205, approximately $184 per square foot. 10100 El Pinar Dr is a home located in Knox County with nearby schools including A.L. Lotts Elementary School, West Valley Middle School, and Farragut High School.
Ownership History
Date
Name
Owned For
Owner Type
Purchase Details
Closed on
Feb 13, 2019
Sold by
Snelling Gerald Wayne and Estate Of Ernest Eugene Picket
Bought by
Snelling Gerald Wayne
Current Estimated Value
Purchase Details
Closed on
Sep 28, 2007
Sold by
Collins & Shuler Management Group Inc
Bought by
Pickett Ernest E
Home Financials for this Owner
Home Financials are based on the most recent Mortgage that was taken out on this home.
Original Mortgage
$276,000
Interest Rate
6.57%
Mortgage Type
Purchase Money Mortgage
Purchase Details
Closed on
Jun 3, 2005
Sold by
Chopra Raj Dulari
Bought by
Collins & Shuler Management Group Inc
Home Financials for this Owner
Home Financials are based on the most recent Mortgage that was taken out on this home.
Original Mortgage
$275,200
Interest Rate
5.69%
Mortgage Type
Purchase Money Mortgage
Purchase Details
Closed on
Jan 22, 2003
Sold by
Chopra Randhir C and Dulari Chopra R
Bought by
Chopra Randhir C and Chopra Raj Dulari
Create a Home Valuation Report for This Property
The Home Valuation Report is an in-depth analysis detailing your home's value as well as a comparison with similar homes in the area
Home Values in the Area
Average Home Value in this Area
Purchase History
| Date | Buyer | Sale Price | Title Company |
|---|---|---|---|
| Snelling Gerald Wayne | -- | None Available | |
| Pickett Ernest E | $345,000 | Acquire Title Inc | |
| Collins & Shuler Management Group Inc | $249,000 | -- | |
| Chopra Randhir C | -- | -- |
Source: Public Records
Mortgage History
| Date | Status | Borrower | Loan Amount |
|---|---|---|---|
| Previous Owner | Pickett Ernest E | $276,000 | |
| Previous Owner | Collins & Shuler Management Group Inc | $275,200 |
Source: Public Records
Tax History Compared to Growth
Tax History
| Year | Tax Paid | Tax Assessment Tax Assessment Total Assessment is a certain percentage of the fair market value that is determined by local assessors to be the total taxable value of land and additions on the property. | Land | Improvement |
|---|---|---|---|---|
| 2024 | $1,782 | $114,650 | $0 | $0 |
| 2023 | $1,782 | $114,650 | $0 | $0 |
| 2022 | $1,782 | $114,650 | $0 | $0 |
| 2021 | $1,489 | $70,225 | $0 | $0 |
| 2020 | $1,489 | $70,225 | $0 | $0 |
| 2019 | $1,489 | $70,225 | $0 | $0 |
| 2018 | $1,489 | $70,225 | $0 | $0 |
| 2017 | $1,489 | $70,225 | $0 | $0 |
| 2016 | $1,534 | $0 | $0 | $0 |
| 2015 | $1,534 | $0 | $0 | $0 |
| 2014 | $1,534 | $0 | $0 | $0 |
Source: Public Records
Map
Nearby Homes
- 920 Harbor Pointe Way
- 10105 Loma Dr
- 10109 Loma Dr
- 721 Fox Rd
- 737 Bent Ridge Ln
- 10237 Canton Place Ln
- 10120 Fox Cove Rd
- 531 Cumberland Ridge Dr
- 10045 Fox Cove Rd
- 1034 Brittany Deanne Ln
- 926 Andover View Ln
- 924 Ashley Michelle Ct
- 1019 Andover View Ln
- 601 Blowing Rock Ln
- 1029 Perch Dr
- 10033 Autumn Valley Ln Unit 1
- 845 Ashley Michelle Ct
- 624 Valley Hill Ln
- 1269 Bentley Park Ln
- 325 Laurel Ridge Ln
- 10044 El Pinar Dr
- 10104 El Pinar Dr
- 755 Largo Vista Rd
- 10040 El Pinar Dr
- 10108 El Pinar Dr
- 10041 El Pinar Dr
- 920 Fox Rd
- 918 Fox Rd
- 922 Fox Rd
- 924 Fox Rd
- 10036 El Pinar Dr
- 10036 El Pinar Dr Unit 2
- 10109 El Pinar Dr
- 10112 El Pinar Dr
- 914 Fox Rd
- 749 Largo Vista Rd
- 748 Largo Vista Rd
- 10037 El Pinar Dr
- 10116 El Pinar Dr
- 10113 El Pinar Dr