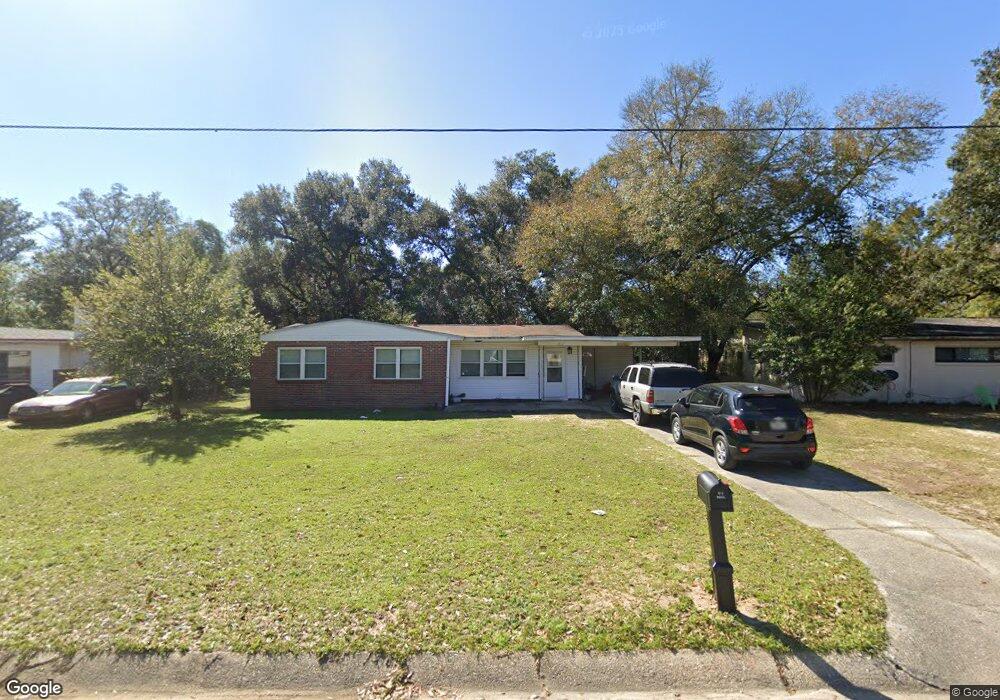
1011 New Mexico Dr Pensacola, FL 32505
Estimated Value: $138,000 - $147,377
--
Bed
2
Baths
1,150
Sq Ft
$126/Sq Ft
Est. Value
About This Home
This home is located at 1011 New Mexico Dr, Pensacola, FL 32505 and is currently estimated at $144,594, approximately $125 per square foot. 1011 New Mexico Dr is a home located in Escambia County with nearby schools including Oakcrest Elementary School, Warrington Middle School, and Escambia High School.
Ownership History
Date
Name
Owned For
Owner Type
Purchase Details
Closed on
Jan 30, 2017
Sold by
Flad Invedtment Lllp
Bought by
Doble J Property Investment Llc
Current Estimated Value
Purchase Details
Closed on
Nov 1, 2016
Bought by
Double J Property Investments
Purchase Details
Closed on
Jan 23, 2001
Sold by
Bankers Tr Co Ca N A
Bought by
Cooper Rhonda J and Weyburn Norma J
Purchase Details
Closed on
Oct 24, 2000
Sold by
Clerk Circuit Court
Bought by
Bankers Tr Co
Purchase Details
Closed on
Sep 17, 1999
Sold by
Bowman Vernon L and Bowman Ruby Lee
Bought by
Jones Signoria L
Home Financials for this Owner
Home Financials are based on the most recent Mortgage that was taken out on this home.
Original Mortgage
$49,000
Interest Rate
8.22%
Purchase Details
Closed on
Oct 21, 1997
Sold by
Cross Dianne S
Bought by
Suchcicki Casey J
Create a Home Valuation Report for This Property
The Home Valuation Report is an in-depth analysis detailing your home's value as well as a comparison with similar homes in the area
Home Values in the Area
Average Home Value in this Area
Purchase History
| Date | Buyer | Sale Price | Title Company |
|---|---|---|---|
| Doble J Property Investment Llc | $20,000 | Attorney | |
| Double J Property Investments | $3,400 | -- | |
| Cooper Rhonda J | $33,000 | -- | |
| Bankers Tr Co | -- | -- | |
| Jones Signoria L | $49,000 | -- | |
| Suchcicki Casey J | $7,800 | -- |
Source: Public Records
Mortgage History
| Date | Status | Borrower | Loan Amount |
|---|---|---|---|
| Previous Owner | Jones Signoria L | $49,000 |
Source: Public Records
Tax History Compared to Growth
Tax History
| Year | Tax Paid | Tax Assessment Tax Assessment Total Assessment is a certain percentage of the fair market value that is determined by local assessors to be the total taxable value of land and additions on the property. | Land | Improvement |
|---|---|---|---|---|
| 2024 | $1,168 | $107,826 | $20,000 | $87,826 |
| 2023 | $1,168 | $56,436 | $0 | $0 |
| 2022 | $995 | $79,714 | $8,000 | $71,714 |
| 2021 | $873 | $59,558 | $0 | $0 |
| 2020 | $763 | $45,332 | $0 | $0 |
| 2019 | $698 | $38,548 | $0 | $0 |
| 2018 | $705 | $38,433 | $0 | $0 |
| 2017 | $1,078 | $28,360 | $0 | $0 |
| 2016 | $164 | $34,282 | $0 | $0 |
| 2015 | $275 | $34,242 | $0 | $0 |
| 2014 | $893 | $33,971 | $0 | $0 |
Source: Public Records
Map
Nearby Homes
- 1014 Kearny Dr
- 1020 E Madison Dr
- 213 Emerald Ave
- 901 S Madison Dr
- 837 S Madison Dr
- 835 S Madison Dr
- 245 Aquamarine Ave
- 823 S Madison Dr
- 1414 Clio Dr
- 200 Georgia Dr
- 814 S Madison Dr
- 1005 Revere Dr
- 6 Georgia Dr
- 102 Tennessee Dr
- 305 N Madison Dr
- 112 Saint Regis Dr
- 2208 Oakwood Ave
- 6001 Toulouse Dr
- 206 Garfield Dr
- 4639 Wabash Ave
- 1013 New Mexico Dr
- 1009 New Mexico Dr
- 1008 Kearny Dr
- 1006 Kearny Dr
- 1010 Kearny Dr
- 1015 New Mexico Dr
- 1004 Kearny Dr
- 1008 New Mexico Dr
- 0 Kearney Dr Unit 585902
- 1007 New Mexico Dr
- 1010 New Mexico Dr
- 1006 New Mexico Dr
- 1012 Kearny Dr
- 1002 Kearny Dr
- 1012 New Mexico Dr
- 1017 New Mexico Dr
- 1000 Edison Dr
- 1003 Edison Dr
- 706 Edison Dr
- 1014 New Mexico Dr