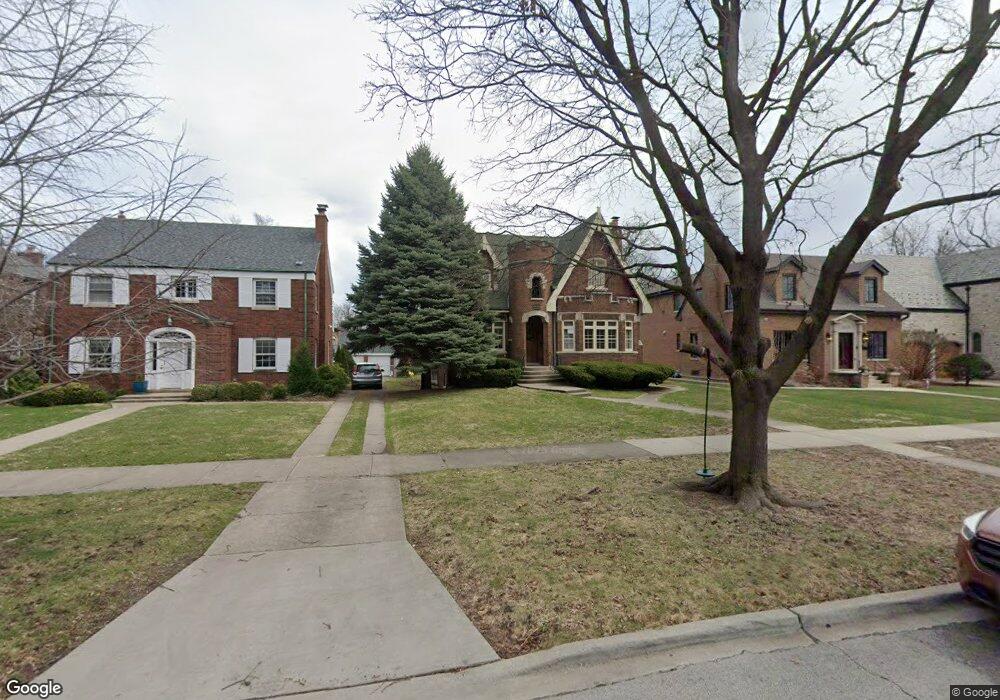
10115 S Bell Ave Chicago, IL 60643
Beverly NeighborhoodEstimated Value: $462,000 - $523,000
4
Beds
3
Baths
1,852
Sq Ft
$265/Sq Ft
Est. Value
About This Home
This home is located at 10115 S Bell Ave, Chicago, IL 60643 and is currently estimated at $490,086, approximately $264 per square foot. 10115 S Bell Ave is a home located in Cook County with nearby schools including Sutherland Elementary School, Morgan Park High School, and St Barnabas Elementary School.
Ownership History
Date
Name
Owned For
Owner Type
Purchase Details
Closed on
Jun 8, 2022
Sold by
Chicago Title Land Trust Company
Bought by
Doubek Donald L and Doubek Karen
Current Estimated Value
Purchase Details
Closed on
May 7, 2022
Sold by
Cronus Projects Llc
Bought by
Doubek Donald L and Doubek Karen
Purchase Details
Closed on
Jul 25, 2003
Sold by
Cronus Projects Llc
Bought by
Bridgeview Bank & Trust and Trust #1-3037
Purchase Details
Closed on
Feb 25, 2003
Sold by
Doubek
Bought by
Cronus Projects Llc
Purchase Details
Closed on
Sep 17, 1997
Sold by
Doubek Donald L
Bought by
Doubek Donald L and Doubek Karen
Home Financials for this Owner
Home Financials are based on the most recent Mortgage that was taken out on this home.
Original Mortgage
$90,100
Interest Rate
7.63%
Create a Home Valuation Report for This Property
The Home Valuation Report is an in-depth analysis detailing your home's value as well as a comparison with similar homes in the area
Home Values in the Area
Average Home Value in this Area
Purchase History
| Date | Buyer | Sale Price | Title Company |
|---|---|---|---|
| Doubek Donald L | -- | None Listed On Document | |
| Doubek Donald L | -- | None Listed On Document | |
| Bridgeview Bank & Trust | -- | -- | |
| Cronus Projects Llc | $14,000 | -- | |
| Cronus Projects Llc | $14,000 | -- | |
| Doubek Donald L | -- | Lawyers Title Insurance Corp |
Source: Public Records
Mortgage History
| Date | Status | Borrower | Loan Amount |
|---|---|---|---|
| Previous Owner | Doubek Donald L | $90,100 |
Source: Public Records
Tax History Compared to Growth
Tax History
| Year | Tax Paid | Tax Assessment Tax Assessment Total Assessment is a certain percentage of the fair market value that is determined by local assessors to be the total taxable value of land and additions on the property. | Land | Improvement |
|---|---|---|---|---|
| 2024 | $5,803 | $42,869 | $15,996 | $26,873 |
| 2023 | $6,152 | $34,068 | $12,900 | $21,168 |
| 2022 | $6,152 | $36,661 | $12,900 | $23,761 |
| 2021 | $7,395 | $40,000 | $12,900 | $27,100 |
| 2020 | $7,123 | $35,000 | $10,320 | $24,680 |
| 2019 | $6,973 | $38,044 | $10,320 | $27,724 |
| 2018 | $6,853 | $38,044 | $10,320 | $27,724 |
| 2017 | $7,571 | $38,468 | $9,288 | $29,180 |
| 2016 | $7,222 | $38,468 | $9,288 | $29,180 |
| 2015 | $6,585 | $38,468 | $9,288 | $29,180 |
| 2014 | $5,759 | $33,531 | $8,772 | $24,759 |
| 2013 | $5,633 | $33,531 | $8,772 | $24,759 |
Source: Public Records
Map
Nearby Homes
- 10057 S Bell Ave
- 2320 W 101st St
- 10127 S Hoyne Ave
- 10022 S Seeley Ave
- 10226 S Hoyne Ave
- 10247 S Bell Ave
- 9833 S Claremont Ave
- 10200 S Artesian Ave
- 9845 S Hoyne Ave
- 10010 S Campbell Ave
- 10337 S Hamilton Ave
- 9817 S Maplewood Ave
- 9646 S Leavitt St
- 2601 W 98th Place
- 1971 W 97th St
- 9945 S Washtenaw Ave
- 9616 S Claremont Ave
- 10023 S Fairfield Ave
- 10425 S Hale Ave Unit 2A
- 1716 W Beverly Glen Pkwy
- 10109 S Bell Ave
- 10109 S Bell Ave
- 10119 S Bell Ave
- 10125 S Bell Ave
- 10101 S Bell Ave
- 10133 S Bell Ave
- 10110 S Leavitt St
- 10106 S Leavitt St
- 10120 S Leavitt St
- 10135 S Bell Ave
- 10100 S Leavitt St
- 10126 S Leavitt St
- 10139 S Bell Ave
- 10114 S Bell Ave
- 10114 S Bell Ave
- 10112 S Bell Ave
- 10118 S Bell Ave
- 10132 S Leavitt St
- 10106 S Bell Ave
- 10122 S Bell Ave