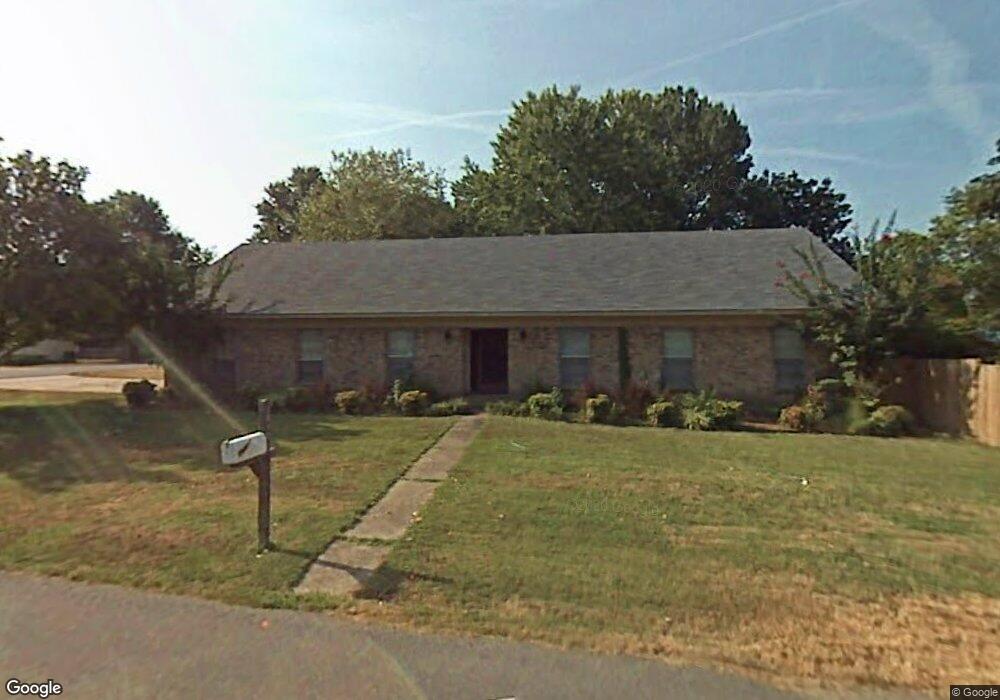
1012 E Woodruff Ave Sherwood, AR 72120
Estimated Value: $232,387 - $270,000
4
Beds
3
Baths
2,113
Sq Ft
$119/Sq Ft
Est. Value
About This Home
This home is located at 1012 E Woodruff Ave, Sherwood, AR 72120 and is currently estimated at $251,847, approximately $119 per square foot. 1012 E Woodruff Ave is a home located in Pulaski County with nearby schools including Oakbrooke Elementary School, Sylvan Hills Middle School, and Sylvan Hills High School.
Ownership History
Date
Name
Owned For
Owner Type
Purchase Details
Closed on
Apr 19, 2018
Sold by
Thomas Claude E
Bought by
Thomas Michael R
Current Estimated Value
Purchase Details
Closed on
Jul 26, 2011
Sold by
Edwards Willie J and Edwards Natasha L
Bought by
Thomas Claude K
Purchase Details
Closed on
Jul 25, 2007
Sold by
Peters Raquel
Bought by
Edwards Willie J and Edwards Natasha L
Home Financials for this Owner
Home Financials are based on the most recent Mortgage that was taken out on this home.
Original Mortgage
$156,813
Interest Rate
6.73%
Mortgage Type
FHA
Purchase Details
Closed on
Jan 28, 2005
Sold by
Powers Marion and Powers Brenda
Bought by
Peters Raquel
Home Financials for this Owner
Home Financials are based on the most recent Mortgage that was taken out on this home.
Original Mortgage
$122,800
Interest Rate
5.85%
Mortgage Type
Purchase Money Mortgage
Create a Home Valuation Report for This Property
The Home Valuation Report is an in-depth analysis detailing your home's value as well as a comparison with similar homes in the area
Home Values in the Area
Average Home Value in this Area
Purchase History
| Date | Buyer | Sale Price | Title Company |
|---|---|---|---|
| Thomas Michael R | -- | None Available | |
| Thomas Claude K | $160,000 | Waco Title Company | |
| Edwards Willie J | $160,000 | Lenders Title Co | |
| Peters Raquel | $123,000 | American Abstract & Title Co |
Source: Public Records
Mortgage History
| Date | Status | Borrower | Loan Amount |
|---|---|---|---|
| Previous Owner | Edwards Willie J | $156,813 | |
| Previous Owner | Peters Raquel | $122,800 |
Source: Public Records
Tax History Compared to Growth
Tax History
| Year | Tax Paid | Tax Assessment Tax Assessment Total Assessment is a certain percentage of the fair market value that is determined by local assessors to be the total taxable value of land and additions on the property. | Land | Improvement |
|---|---|---|---|---|
| 2025 | $1,382 | $34,932 | $5,200 | $29,732 |
| 2024 | $1,382 | $34,932 | $5,200 | $29,732 |
| 2023 | $1,382 | $34,932 | $5,200 | $29,732 |
| 2022 | $1,566 | $34,932 | $5,200 | $29,732 |
| 2021 | $1,522 | $28,270 | $4,800 | $23,470 |
| 2020 | $1,140 | $28,270 | $4,800 | $23,470 |
| 2019 | $1,140 | $28,270 | $4,800 | $23,470 |
| 2018 | $1,165 | $28,270 | $4,800 | $23,470 |
| 2017 | $1,156 | $28,270 | $4,800 | $23,470 |
| 2016 | $1,382 | $27,960 | $5,200 | $22,760 |
| 2015 | $1,347 | $26,522 | $5,200 | $21,322 |
| 2014 | $1,347 | $26,522 | $5,200 | $21,322 |
Source: Public Records
Map
Nearby Homes
- 109 Pamela Ln
- 111 Pamela Ln
- 14 Pamela Ln
- 2949 Maelstrom Cir
- 616 E Woodruff Ave
- 9460 Robin Ln
- 9318 Woodbine Sttreet
- 3032 Overcup Dr
- 1300 E Maryland Ave
- 519 Hillcrest Rd
- 9125 Woodbine St
- Lot 4 Johnson Dr
- 00 Johnson Dr
- Lot 2 Johnson Dr
- Lot 6 Johnson Dr
- Lot 5 Johnson Dr
- Lot 1 Johnson Dr
- 59 Wesley Dr
- 2117 Ingleside Dr
- 2520 Austin Oaks Dr
- 32 Patty Ln
- 1 Pamela Ln
- 1007 E Woodruff Ave
- 30 Patty Ln
- 1011 E Woodruff Ave
- 0 Pamela Ln
- 911 E Woodruff Ave
- 1016 E Woodruff Ave
- 3 Pamela Ln
- 907 E Woodruff Ave
- 28 Patty Ln
- 29 Patty Ln
- 4 Pamela Ln
- 100 Pamela Ln
- 27 Patty Ln
- 26 Patty Ln
- 904 E Woodruff Ave
- 905 E Woodruff Ave
- 5 Pamela Ln
- 1104 E Woodruff Ave