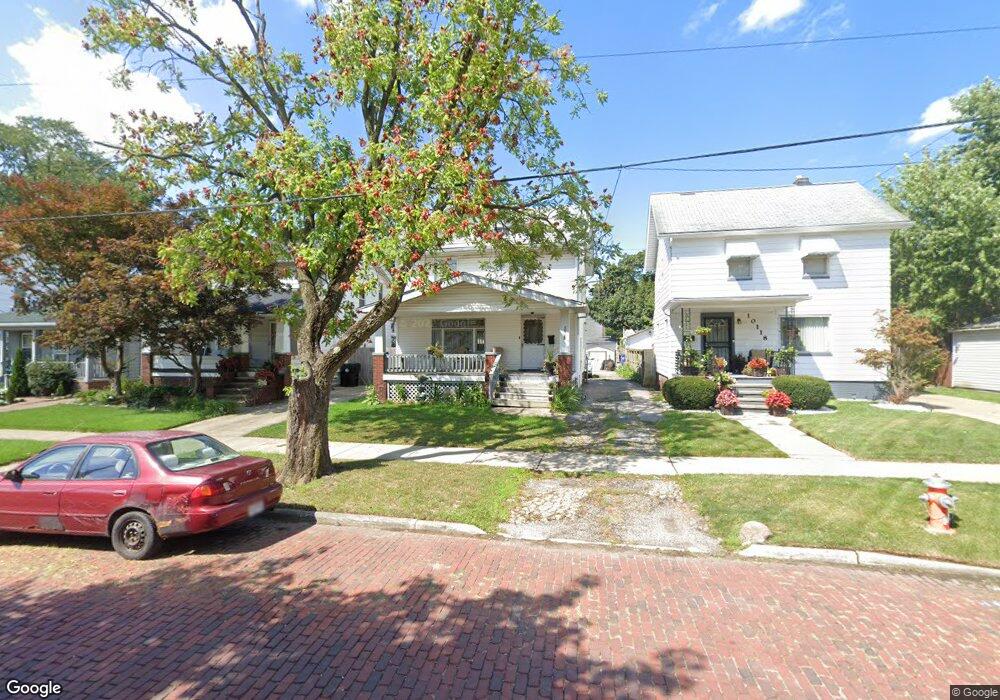
10122 Thrush Ave Cleveland, OH 44111
West Boulevard NeighborhoodEstimated Value: $131,512 - $162,000
3
Beds
1
Bath
1,177
Sq Ft
$123/Sq Ft
Est. Value
About This Home
This home is located at 10122 Thrush Ave, Cleveland, OH 44111 and is currently estimated at $144,378, approximately $122 per square foot. 10122 Thrush Ave is a home located in Cuyahoga County with nearby schools including Almira Academy, Artemus Ward School, and Benjamin Franklin.
Ownership History
Date
Name
Owned For
Owner Type
Purchase Details
Closed on
Nov 30, 2012
Sold by
Akel Akel
Bought by
Akel Akel and Akel Sahar F
Current Estimated Value
Purchase Details
Closed on
Mar 13, 2008
Sold by
Fifth Third Mortgage Co
Bought by
Akel Akel
Purchase Details
Closed on
Jul 20, 2006
Sold by
Miranda Ignacio and Miranda Sabrina L
Bought by
Fifth Third Mortgage Co
Purchase Details
Closed on
Jul 27, 2000
Sold by
Antonina Gorecki
Bought by
Miranda Ignacio and Miranda Sabrina L
Home Financials for this Owner
Home Financials are based on the most recent Mortgage that was taken out on this home.
Original Mortgage
$76,500
Interest Rate
8.27%
Purchase Details
Closed on
Feb 2, 1994
Sold by
Oneil Erin M
Bought by
Gorecki Antonina
Purchase Details
Closed on
Jan 12, 1988
Sold by
Durell Jack
Bought by
Oneil Erin M
Purchase Details
Closed on
Jan 1, 1975
Bought by
Durell Jack
Create a Home Valuation Report for This Property
The Home Valuation Report is an in-depth analysis detailing your home's value as well as a comparison with similar homes in the area
Home Values in the Area
Average Home Value in this Area
Purchase History
| Date | Buyer | Sale Price | Title Company |
|---|---|---|---|
| Akel Akel | -- | Resource Title Agency | |
| Akel Akel | $27,500 | None Available | |
| Fifth Third Mortgage Co | $56,667 | Attorney | |
| Miranda Ignacio | $76,500 | -- | |
| Gorecki Antonina | $56,500 | -- | |
| Oneil Erin M | $36,800 | -- | |
| Durell Jack | -- | -- |
Source: Public Records
Mortgage History
| Date | Status | Borrower | Loan Amount |
|---|---|---|---|
| Previous Owner | Miranda Ignacio | $76,500 |
Source: Public Records
Tax History Compared to Growth
Tax History
| Year | Tax Paid | Tax Assessment Tax Assessment Total Assessment is a certain percentage of the fair market value that is determined by local assessors to be the total taxable value of land and additions on the property. | Land | Improvement |
|---|---|---|---|---|
| 2024 | $2,680 | $40,075 | $8,750 | $31,325 |
| 2023 | $1,960 | $25,280 | $5,430 | $19,850 |
| 2022 | $1,949 | $25,270 | $5,430 | $19,850 |
| 2021 | $1,930 | $25,270 | $5,430 | $19,850 |
| 2020 | $1,716 | $19,430 | $4,170 | $15,260 |
| 2019 | $1,590 | $55,500 | $11,900 | $43,600 |
| 2018 | $1,585 | $19,430 | $4,170 | $15,260 |
| 2017 | $1,814 | $21,460 | $3,540 | $17,920 |
| 2016 | $1,801 | $21,460 | $3,540 | $17,920 |
| 2015 | $1,963 | $21,460 | $3,540 | $17,920 |
| 2014 | $1,963 | $23,310 | $3,850 | $19,460 |
Source: Public Records
Map
Nearby Homes
- 3598 W 103rd St
- 10326 Thrush Ave
- 10612 Linnet Ave
- 3515 W 100th St
- 10411 Jasper Rd
- 10310 Adelaide Ave
- 10917 Linnet Ave
- 10909 Fortune Ave
- 3512 W 98th St
- 3515 W 98th St
- 10216 Champion Ave
- 11101 Fortune Ave
- 3451 W 98th St
- 3497 W 97th St
- 3500 W 95th St
- 3393 W 99th St
- 10402 Almira Ave
- 3348 W 100th St
- 10904 Dixon Rd
- 3628 W 114th St
- 10126 Thrush Ave
- 10118 Thrush Ave
- 10130 Thrush Ave
- 10200 Thrush Ave
- 10221 Dale Ave
- 10225 Dale Ave
- 10217 Dale Ave
- 3664 West Blvd
- 10204 Thrush Ave
- 3670 West Blvd
- 10229 Dale Ave
- 3595 W 102nd St
- 3658 West Blvd
- 10233 Dale Ave
- 10213 Dale Ave
- 10208 Thrush Ave
- 3652 West Blvd
- 3599 W 102nd St
- 10301 Dale Ave
- 3678 West Blvd