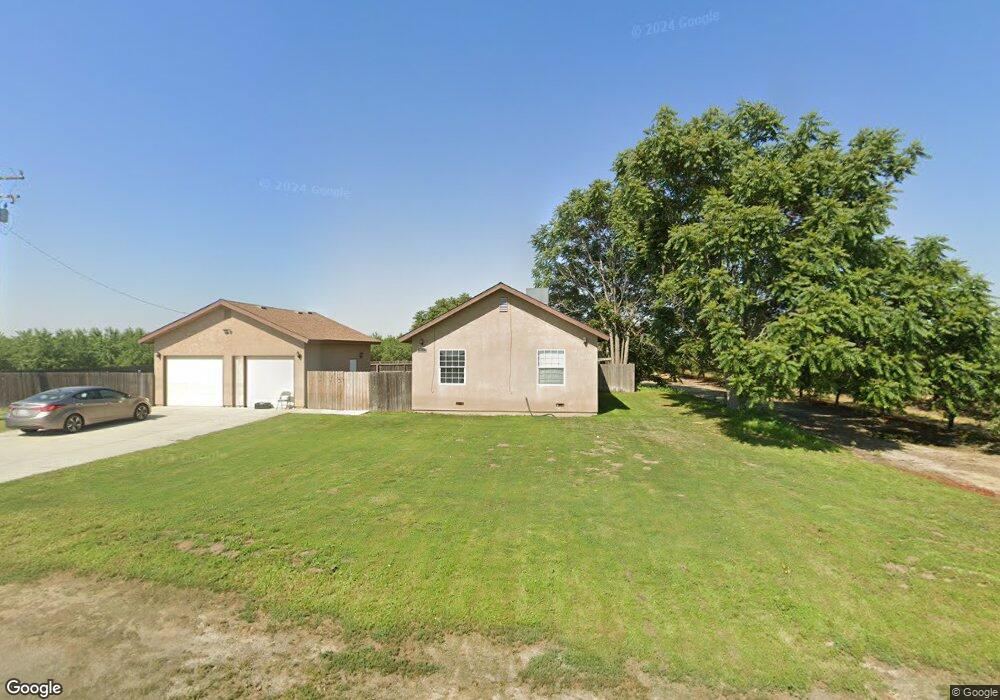
10130 7th Ave Hanford, CA 93230
Estimated Value: $390,000 - $1,996,000
3
Beds
2
Baths
1,132
Sq Ft
$1,054/Sq Ft
Est. Value
About This Home
This home is located at 10130 7th Ave, Hanford, CA 93230 and is currently estimated at $1,193,000, approximately $1,053 per square foot. 10130 7th Ave is a home located in Kings County with nearby schools including Kit Carson Elementary School, Hanford High School, and Mid Valley Charter Home School.
Ownership History
Date
Name
Owned For
Owner Type
Purchase Details
Closed on
May 1, 2019
Sold by
Danell Barbara E
Bought by
Michael J Danell Bypass Trust
Current Estimated Value
Purchase Details
Closed on
Apr 17, 2019
Sold by
Danell Barbara E
Bought by
Michael J Danell Bypass Trust
Purchase Details
Closed on
Aug 16, 2011
Sold by
Danell Claire L
Bought by
Irrevocable Danell Justin
Purchase Details
Closed on
Jun 30, 2008
Sold by
Danell Claire L and Danell Danny
Bought by
State Of California
Purchase Details
Closed on
Aug 21, 2003
Sold by
Danell Danny and Danell Linda
Bought by
Danell Danny and Danell Linda
Purchase Details
Closed on
Mar 20, 2003
Sold by
Danell Michael J and Danell Barbara E
Bought by
Danell Michael J and Danell Barbara E
Create a Home Valuation Report for This Property
The Home Valuation Report is an in-depth analysis detailing your home's value as well as a comparison with similar homes in the area
Home Values in the Area
Average Home Value in this Area
Purchase History
| Date | Buyer | Sale Price | Title Company |
|---|---|---|---|
| Michael J Danell Bypass Trust | -- | None Listed On Document | |
| Michael J Danell Family Revoca | -- | -- | |
| Michael J Danell Bypass Trust | -- | None Listed On Document | |
| Michael J Danell Family Revoca | -- | -- | |
| Irrevocable Danell Justin | -- | None Available | |
| State Of California | -- | Chicago Title Company | |
| Danell Danny | -- | -- | |
| Danell Danny | -- | -- | |
| Danell Michael J | -- | -- | |
| Danell Michael J | -- | -- |
Source: Public Records
Tax History Compared to Growth
Tax History
| Year | Tax Paid | Tax Assessment Tax Assessment Total Assessment is a certain percentage of the fair market value that is determined by local assessors to be the total taxable value of land and additions on the property. | Land | Improvement |
|---|---|---|---|---|
| 2025 | $7,772 | $659,558 | $370,918 | $288,640 |
| 2023 | $7,772 | $481,018 | $281,787 | $199,231 |
| 2022 | $5,172 | $433,966 | $223,803 | $210,163 |
| 2021 | $5,921 | $514,106 | $242,887 | $271,219 |
| 2020 | $5,958 | $513,400 | $222,689 | $290,711 |
| 2019 | $5,983 | $511,475 | $213,627 | $297,848 |
| 2018 | $6,809 | $291,475 | $194,977 | $96,498 |
| 2017 | $7,516 | $672,262 | $221,966 | $450,296 |
| 2016 | $8,026 | $731,777 | $265,026 | $466,751 |
| 2015 | $8,069 | $734,351 | $268,993 | $465,358 |
| 2014 | $7,645 | $688,898 | $228,761 | $460,137 |
Source: Public Records
Map
Nearby Homes
- 9893 Vista Ave
- 8586 Curtis St
- 8625 La Vaca Way
- 8685 Eddy St
- 8650 Lacey Blvd
- 0 Houston Ave Unit 236309
- 0 Houston Ave Unit 20764276
- 0 Houston Ave Unit 231429
- 0 Houston Ave Unit 235985
- 9837 9 1 4 Ave
- 0 9 1 2 Ave
- 1205 Hawthorn St
- 10448 9 1 2 Ave
- 1133 Summer Field Dr
- 1 E 3rd St
- 98379 9 1 4 Ave
- 1249 Levich St